

Three months into working with a furniture retailer, their marketing director pulled me aside during a quarterly review. "Look at these numbers," she said, sliding her laptop across the conference table. The SEO report showed everything trending up—organic sessions had jumped 47% year-over-year, they'd captured first-page rankings for dozens of commercial keywords, their domain rating climbed from 42 to 58. The revenue report told a different story. Online sales from organic traffic had actually dropped by $34,000 that quarter.
This disconnect happens constantly in business. Marketing teams celebrate vanity metrics while finance teams wonder why the P&L hasn't improved. The problem isn't just picking the wrong KPIs to track—most businesses lack any systematic way to connect search visibility to actual revenue outcomes.
They're flying blind, making decisions based on incomplete data, running experiments without understanding their true impact. The larger the organization grows, the more expensive these blind spots become.
Why measurement breaks down past the startup stage
Small operations can survive without sophisticated measurement. When you're managing 30 product pages and a handful of blog posts, the relationship between traffic and sales stays relatively straightforward. More visitors usually means more revenue.
But around the 500-page mark, everything changes. Suddenly you've got informational content pulling thousands of visitors who never buy anything. Product pages with terrible visibility somehow generate most of your margin. Landing pages that convert paid traffic at 6% convert organic traffic at 0.8%. The simple relationships that worked before completely fall apart.
The complexity multiplies when you factor in different customer segments finding you through different keywords, seasonality affecting both search behavior and purchase patterns, content serving multiple purposes across the buyer journey, attribution windows that stretch across weeks or months, and experiments running simultaneously on different page segments.
Without proper measurement frameworks, you end up making decisions based on correlation and gut feel. Maybe that traffic spike in March was from your new content strategy. Or maybe it was just tax refund season.
Building measurement infrastructure that actually works
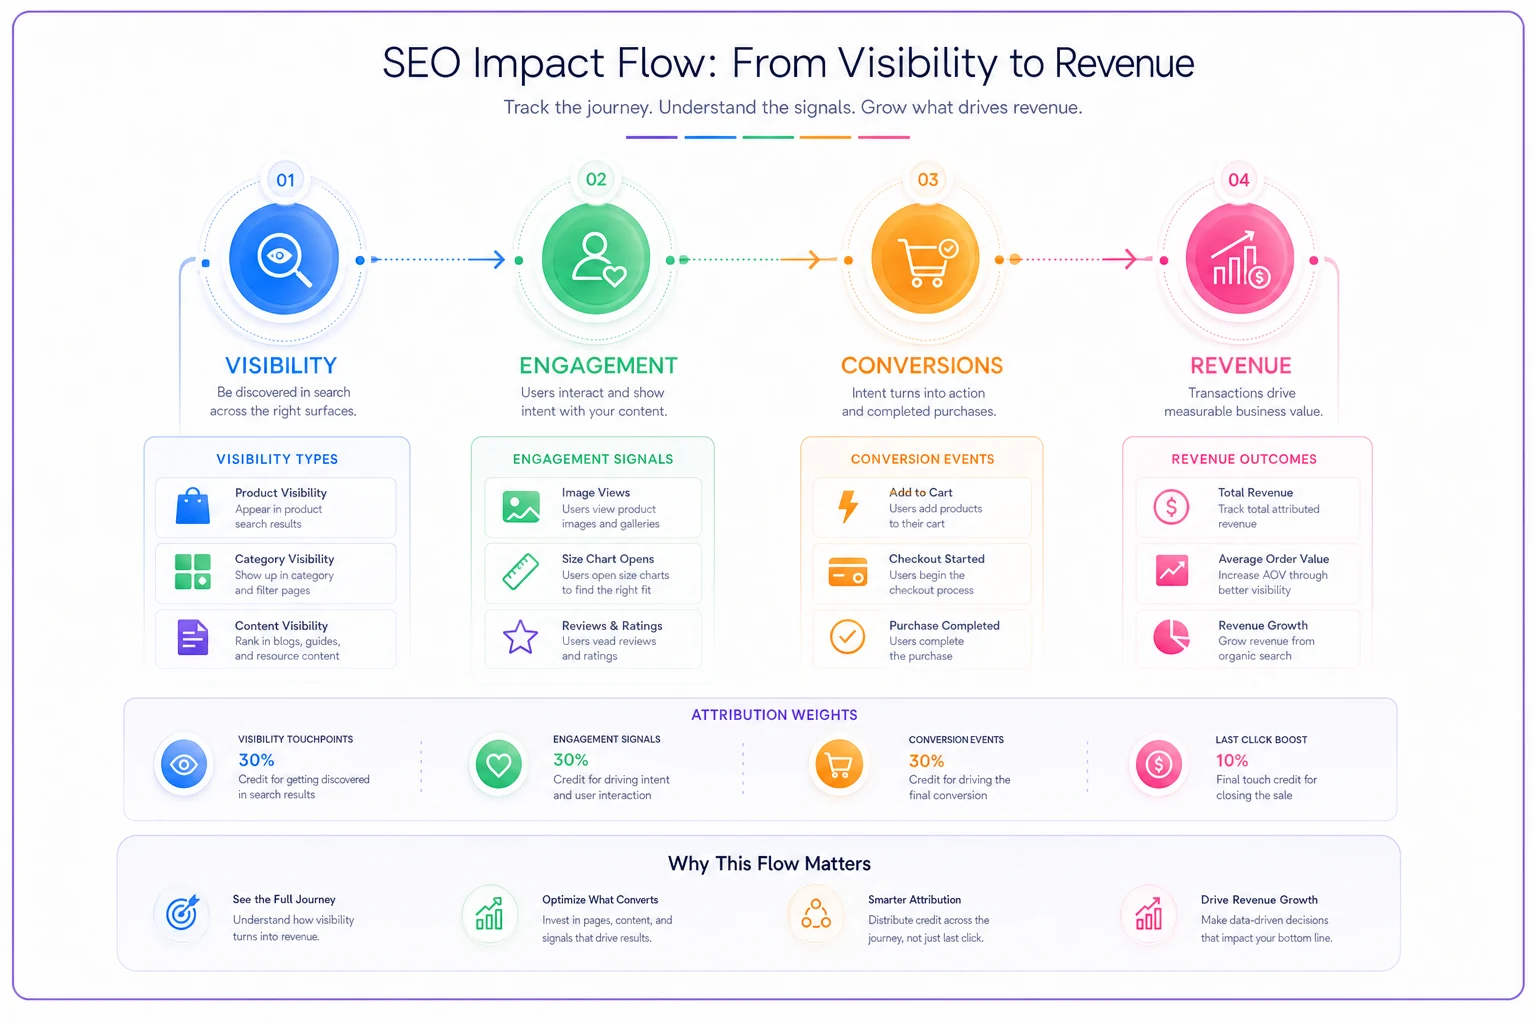
Successful frameworks share the same modular structure—visibility flows into engagement, engagement drives conversions, conversions generate revenue. Miss any connection point and the whole system breaks.
Stop losing visibility in search results.
GoSeofy helps you monitor, analyze, and improve your SEO performance with ease.
- Comprehensive keyword tracking
- Backlink quality monitoring
- Real-time SEO performance reports
No credit card required
Here's a simple diagram of the visibility→engagement→conversions→revenue flow.
The visibility layer
Most businesses track the wrong visibility metrics. They obsess over total impressions or average position across all keywords. But a million impressions for "what is furniture" means nothing if those searchers never buy. Meanwhile, 200 impressions for "modern sectional sofa with chaise" could drive real revenue.
Segment your visibility tracking by intent. High-intent pages need aggressive tracking—product and category pages, pricing and comparison pages, store locator or "where to buy" pages, demo request or trial pages. Support-intent pages require selective tracking—FAQ and help content, shipping and return policy pages, product guides and specifications. Awareness pages just need context tracking—blog posts and articles, industry news and updates, company and about pages.
Set up Search Console API exports that separate these segments. This query structure provides actionable data:
WITH pageclassification AS ( SELECT page, CASE WHEN page LIKE '%/product/%' THEN 'product' WHEN page LIKE '%/category/%' THEN 'category' WHEN page LIKE '%/pricing%' THEN 'commercial' WHEN page LIKE '%/blog/%' THEN 'content' ELSE 'other' END AS pagetype FROM searchconsoledata ), performancesummary AS ( SELECT pc.pagetype, COUNT(DISTINCT pc.page) as pagecount, SUM(scd.clicks) as totalclicks, SUM(scd.impressions) as totalimpressions, AVG(scd.position) as avgposition FROM pageclassification pc JOIN searchconsoledata scd ON pc.page = scd.page WHERE scd.date >= DATESUB(CURRENTDATE, INTERVAL 28 DAY) GROUP BY pc.pagetype ) SELECT * FROM performancesummary ORDER BY totalclicks DESC;
This immediately shows which page types drive real traffic versus just impressions. You might discover your blog generates 70% of impressions but only 15% of clicks, while product pages with lower visibility drive most valuable traffic.
Engagement signals that predict revenue
Bounce rate tells you almost nothing useful about SEO performance. Someone bouncing from a blog post after finding their answer isn't a failure. Someone bouncing from a product page without engaging is a massive problem.
Track engagement patterns that correlate with purchase behavior. An outdoor gear retailer identified these engagement signals as strong purchase predictors—viewing multiple product images produced roughly 2x conversion improvement, checking size charts increased conversions around 80%, reading customer reviews doubled conversion rates, and adding items to wishlist made customers over 3x more likely to buy.
Build event tracking that captures these micro-conversions:
// Track product page engagement depth let engagementScore = 0; const engagementActions = { 'imagegalleryview': 15, 'sizechartopen': 20, 'reviewsectionreach': 25, 'specificationtabclick': 20, 'wishlistadd': 40 }; // Fire when engagement threshold reached if (engagementScore >= 50) { gtag('event', 'qualifiedproductengagement', { 'pagepath': window.location.pathname, 'engagementscore': engagementScore, 'trafficsource': 'organic', 'product_category': productCategory }); }
Compare engagement patterns between traffic sources. Organic visitors who reach your site through informational queries engage differently than those arriving through commercial searches.
Attribution models that reflect reality
Last-click attribution makes SEO look terrible. First-click attribution oversells its impact.
A home improvement retailer discovered their typical customer journey involved initial research via organic search ("kitchen remodel ideas"), multiple return visits through direct traffic, comparison shopping through paid ads, and final purchase through branded search.
Under last-click attribution, SEO got credit for 11% of revenue. Under a custom model that weighted discovery and research phases, SEO's contribution jumped to 34%.
Build a simple weighted attribution model:
| Touch Point | Weight | Justification |
|---|---|---|
| First touch (discovery) | 35% | Introduces new customers |
| Middle touches (research) | 40% | Influences consideration |
| Last touch (transaction) | 25% | Closes the sale |
Apply this to your conversion data:
WITH userjourneys AS ( SELECT userid, sessionnumber, trafficsource, conversionvalue, CASE WHEN sessionnumber = 1 THEN 0.35 WHEN sessionnumber = MAX(sessionnumber) OVER(PARTITION BY userid) THEN 0.25 ELSE 0.40 / (COUNT() OVER(PARTITION BY userid) - 2) END AS attributionweight FROM sessiondata WHERE conversionvalue > 0 ) SELECT trafficsource, SUM(conversionvalue attributionweight) as attributedrevenue, COUNT(DISTINCT userid) as influencedcustomers FROM userjourneys GROUP BY trafficsource ORDER BY attributedrevenue DESC;
This approach shows real influence patterns instead of just final touch points.
Revenue tracking beyond simple conversion rates
Conversion rate only tells part of the revenue story. A 3% conversion rate sounds great until you realize those conversions have half the average order value of other channels.
Track the full revenue picture. Track conversion rate by landing page type, average order value by keyword category, customer lifetime value by acquisition source, and return and refund rates by traffic source. One pattern that emerges regularly—organic traffic from research-intent keywords often produces higher lifetime value customers. They've done their homework, understand the product, and make fewer returns.
Experiment design that prevents measurement contamination
Running multiple SEO tests simultaneously usually ends in confusion. You update title tags, restructure navigation, and refresh content all in the same month. Traffic increases 20%. Which change drove it? Nobody knows.
The solution isn't to run one test at a time—that's too slow. Instead, isolate your experiments by page segment.
Example experiment isolation plan:
-
Week 1-4
Test new meta descriptions on category pages only
-
Week 3-6
Test FAQ schema on product pages
-
Week 5-8
Test content updates on blog posts
Each experiment runs independently on distinct page sets. When category page CTR improves, you know it's the meta descriptions. When product pages gain featured snippets, it's the schema markup.
Document your experiments in a simple tracking system:
| Test ID | Hypothesis | Page Segment | Dates | Success Metric | Result | Revenue Impact |
|---|---|---|---|---|---|---|
| SEO-047 | Emotional headlines increase CTR | /blog/guides/* | Mar 1-29 | CTR > 4.5% | 4.8% CTR | +$2,800/mo |
| SEO-048 | Comparison tables improve rankings | /versus/* | Mar 10-Apr 10 | Position < 5 | Position 6→4 | +$4,100/mo |
| SEO-049 | Video thumbnails boost engagement | /tutorials/* | Mar 15-Apr 15 | Bounce < 60% | 58% bounce | Minimal |
Each test has clear isolation, specific success criteria, and tracked revenue impact. This prevents the "we think this worked but we're not sure" problem that plagues most SEO programs.
Alert systems that catch problems before they snowball
SEO disasters rarely announce themselves. Rankings slowly erode for weeks before traffic collapses. A technical issue blocks pages gradually until revenue tanks.
Build early warning systems for common failure points.
Indexation monitoring
Track the ratio of indexed to published pages. When this drops below 90%, something's wrong:
SELECT DATE(timestamp) as checkdate, totalpagespublished, totalpagesindexed, ROUND((totalpagesindexed / totalpagespublished * 100), 1) as indexationrate FROM indexationtracking WHERE indexationrate < 90 ORDER BY check_date DESC LIMIT 7;
Traffic volatility alerts
-
Daily variance > 30% from 7-day average
-
Weekly decline > 20% for any major segment
-
Sudden shifts in traffic distribution between page types
Conversion degradation warnings
-
Engagement rate drops 15% week-over-week
-
Add-to-cart rate falls below historical minimum
-
Session duration decreases 25% for product pages
A lighting retailer caught a major issue this way. Traffic remained steady but engagement metrics started declining on mobile devices. Investigation revealed their product image carousel was broken on iOS devices—affecting 40% of their traffic but invisible in standard analytics.
Dashboard architecture beyond vanity metrics
Traditional SEO dashboards show what happened. Useful dashboards show what needs attention. Structure your dashboards by decision-making frequency.
Daily Operations Dashboard
-
Pages with traffic drops > 25%
-
New 404 errors or redirect chains
-
Conversion rate by page template
-
Experiments currently running
Weekly Planning Dashboard
-
Segment performance vs targets
-
Content gaps and opportunities
-
Competitive visibility changes
-
Resource allocation efficiency
Monthly Strategy Dashboard
-
Revenue attribution by channel
-
Customer acquisition cost trends
-
Lifetime value by traffic source
-
Market share estimates
Each dashboard should answer specific questions. Instead of "How much traffic did we get?" ask "Which segments underperformed targets?" Instead of "What's our average position?" ask "Which commercial pages lost visibility?" Instead of "How many conversions?" ask "What's our revenue per thousand impressions?"
Connecting measurement to business planning cycles
The measurement framework becomes powerful when it drives actual business decisions. Most companies set arbitrary SEO goals disconnected from revenue needs. "Increase organic traffic 50%" sounds good but means nothing without context.
Work backwards from business objectives. A B2B software company needed $3.2M in annual recurring revenue from organic channels:
Starting Point: $3.2M ARR target
-
Average contract value
$24,000/year
-
Contracts needed
134
-
Close rate from trial
15%
-
Trials needed
893
-
Trial signup rate
1.8%
-
Qualified sessions needed
49,611
-
Organic CTR average
3.2%
-
Impressions needed
1,550,344
This reveals exactly what needs to improve. If they can boost trial signup rate from 1.8% to 2.5%, they need 35% fewer sessions. If CTR improves to 4%, impression requirements drop by 20%. Each metric improvement cascades through the framework.
Set quarterly checkpoints that adjust based on performance:
Q1 actual: 312K impressions (target was 387K). Visibility gap identified. Content production increased. Technical fixes prioritized.
Q2 actual: 428K impressions (target was 387K). Ahead on visibility. But trial signups lagging at 1.4%. Shifted focus to conversion optimization.
Q3 actual: Revenue tracking 8% ahead of plan. Conversion improvements working. Reduced content production. Invested in retention instead.
Decision frameworks for experiment prioritization
Not every SEO opportunity deserves testing. Some changes are obvious wins. Others will never generate enough data for statistical significance.
Apply this prioritization framework:
Immediate implementation (no test needed)
Critical technical fixes, clear Google guideline violations, accessibility improvements, and mobile usability issues.
Test before scaling
Content format changes, internal linking strategies, title tag optimizations, and schema markup additions.
Skip entirely (not worth the effort)
Minor copy tweaks on low-traffic pages, meta description updates for awareness content, keyword density adjustments, and header tag reorganization.
A healthcare platform learned this lesson after spending two months testing meta descriptions on blog posts that generated less than 100 visits monthly. The test never reached statistical significance, provided no actionable insights, and distracted from improvements to their appointment booking pages that drove actual revenue.
Real measurement impact on business outcomes
An industrial equipment supplier had been investing roughly $18K monthly in content and SEO services for two years. They could show impressive vanity metrics—2,400 published pages, 180,000 monthly organic sessions, rankings for thousands of keywords. But they couldn't connect any of it to revenue.
We rebuilt their measurement framework over eight weeks. Connected Search Console to their CRM through custom attribution modeling. Built segment-specific dashboards for product categories. Established experiment protocols for their content team.
The first revelation: 78% of their organic traffic went to educational content that never converted. Meanwhile, 31 product category pages generated 89% of organic revenue despite receiving only 12% of traffic. Their content strategy was completely misaligned with revenue generation.
They shifted resources immediately. Stopped publishing generic industry news. Started optimizing existing commercial pages. Built comparison guides for high-value equipment. Created detailed specification content for their most profitable products.
Six months later—organic traffic decreased 23% (cutting low-value content), organic revenue increased $267K, cost per acquisition dropped from around $430 to $195, and marketing qualified leads from organic increased roughly 4x.
Less traffic, more revenue. Fewer pages, better results. Clear attribution, justified investment.
Making measurement sustainable long-term
Complex measurement systems usually collapse under their own weight. Too many metrics to track, too many dashboards to maintain, too many experiments to analyze. Teams abandon them within months.
Keep your framework sustainable by:
-
Automating data collection (don't rely on manual exports or spreadsheet updates)
-
Limiting core metrics (track everything, but focus on 5-7 metrics that truly matter)
-
Standardizing experiment protocols (create templates for common tests)
-
Scheduling regular reviews (weekly operational checks, monthly performance analysis, quarterly strategy adjustment)
-
Training multiple team members on the system
If only one person understands the measurement framework, it'll die when they leave.
The goal isn't perfect measurement. It's sustainable measurement that drives better decisions over time. A simple framework used consistently beats a complex system that gets abandoned.
Start with basic visibility-to-revenue tracking. Add layers as you prove value. Build momentum gradually instead of trying to implement everything at once. AI-powered operational software platforms can automate much of the data collection and reporting, letting teams focus on insights rather than spreadsheet management.
Ready to elevate your search rankings?
Join 5,000+ businesses using GoSeofy to increase organic traffic, optimize content, and outperform competitors online.