



Most SEO alerting setups fail the same way: they fire too much, they fire too late, or they fire about things nobody can tie back to revenue. You end up with a Slack channel everyone has muted and a PagerDuty rotation that engineers quietly route to voicemail. The detection logic might be fine. The problem is everything downstream — thresholds, payloads, severity mapping, deduplication, and the scoring that decides whether a drop is worth waking someone up at 2am.
This playbook is the operational layer that sits on top of detection. It assumes you already have the pipelines, log parsing, and GSC/GA4 joins from earlier work (if your joins aren't trustworthy yet, start with indexation blind spots via log-file analysis before building alerting on top of shaky data). What follows is the part nobody writes down: the actual rules, the payload schema, the math behind a Conversion Impact Score, and the routing logic that keeps noise out.
The core problem: detection ≠ a good alert
A detector that notices "clicks for /category/running-shoes dropped 40% day-over-day" is not an alert. It's a signal. An alert is that signal plus answers to four questions an on-call person needs within ten seconds:
-
How much revenue is actually exposed?
-
Is this real, or is it sampling/seasonality/a verified-bot artifact?
-
Who owns it and how fast do they need to move?
-
What's the first thing to check?
If your alert payload can't answer those, you've just forwarded a problem instead of triaging one. Teams invest heavily in detection sensitivity and almost nothing in suppression, scoring, and context. So alerts technically "work" and nobody trusts them.
Teams invest heavily in detection sensitivity and almost nothing in suppression, scoring, and context. So alerts technically "work" and nobody trusts them.
A reusable alert-rule library (with default thresholds)
Treat the thresholds below as defaults to tune against your own variance — a site doing 2M clicks/day has a very different noise floor than one doing 20k. The shape of each rule matters more than the exact number.
Stop losing visibility in search results.
GoSeofy helps you monitor, analyze, and improve your SEO performance with ease.
- Comprehensive keyword tracking
- Backlink quality monitoring
- Real-time SEO performance reports
No credit card required
| Rule | Signal source | Default trigger | Window | Notes |
|---|---|---|---|---|
| Clicks cliff (page-level) | GSC | −35% vs 14-day median, min 50 baseline clicks | 1 day | Ignore pages below baseline floor |
| Impressions collapse | GSC | −50% vs 14-day median | 1 day | Often leads clicks by 24–48h |
| Position decay (cluster) | GSC | avg position +3.0 across ≥5 URLs in a cluster | 3 days | Cluster-level kills single-URL noise |
| Indexed-count drop | GSC Index Coverage | −10% valid pages in a template | 1 day | Maps to template/engineering owner |
| Crawl spike / waste | CDN + server logs | bot requests +60% with no index gain | 6h | Crawl budget drain |
| 5xx/soft-404 surge | Logs + GSC | 4xx/5xx ratio >2% of Googlebot hits | 1h | Fast-path, high severity |
| Canonical flip | Crawl diff | >3% of template URLs change canonical target | 1 day | Common after deploys |
| Conversion-weighted traffic drop | GA4 + GSC | CIS ≥ 60 (see below) | 1 day | The one that pages people |
for entity in entities(scope): # page, cluster, template baseline = robustmedian(entity.metric, window=14d) if baseline < FLOOR: # skip low-volume noise continue delta = (entity.metric.today - baseline) / baseline if delta <= THRESHOLD: candidate = buildcandidate(entity, baseline, delta) if not suppressed(candidate): # see suppression section emit(candidate)
Two things people skip and regret: use a robust median or trimmed mean, not a plain mean (one holiday spike will poison your baseline for two weeks), and always enforce a volume floor. A large share of false alerts trace back to low-traffic URLs swinging wildly on tiny absolute numbers.
Use a robust median and enforce a conservative volume floor per entity to cut low-volume false positives early.
Here's a simple detection-to-alert workflow that matches the pseudocode above.
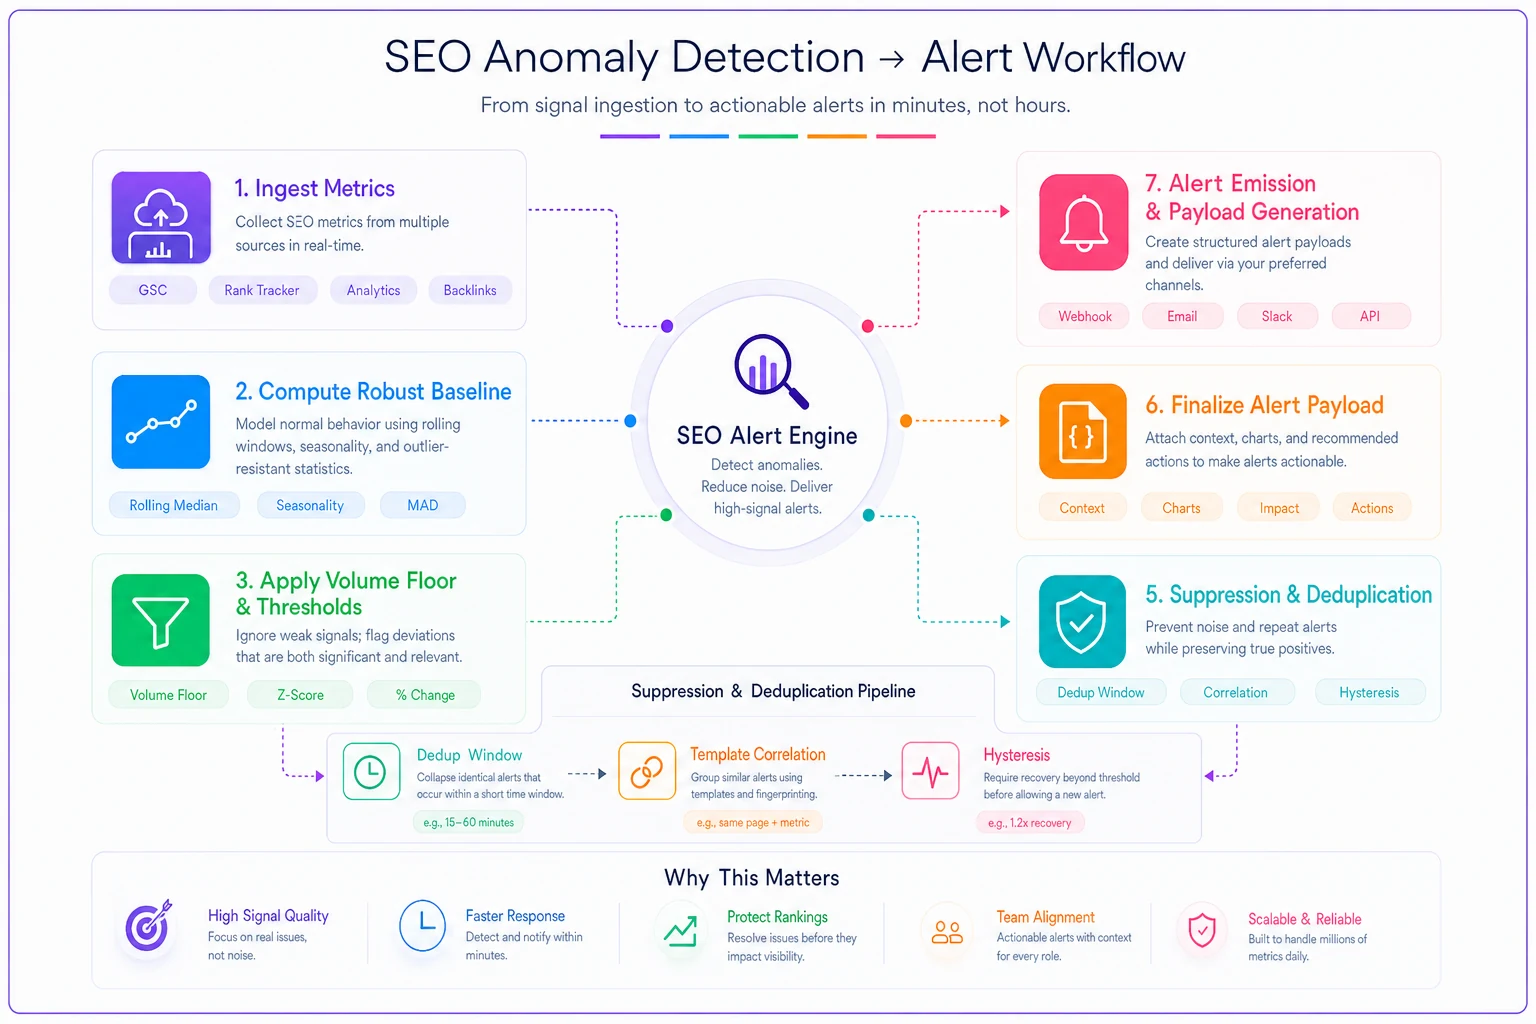
A large share of false alerts trace back to low-traffic URLs swinging wildly on tiny absolute numbers.
The canonical alert payload (hand this to engineering)
Every alert — regardless of source — should serialize into one schema. When detection outputs are inconsistent, engineers build one-off handlers and the whole system rots. A single payload template means dashboards, dedup logic, and ticket creation all speak the same language.
{ "alertid": "clk-cliff-2026-04-12-cat-running-shoes", "rule": "clickscliffpage", "severity": "SEV2", "entity": { "type": "page", "url": "/category/running-shoes", "cluster": "footwear", "template": "categoryv3", "ownerteam": "ecommerce-seo" }, "signal": { "metric": "gscclicks", "baseline": 1420, "observed": 870, "deltapct": -38.7, "window": "1d", "detectedat": "2026-04-12T07:14:00Z" }, "conversionimpact": { "cis": 72, "estdailyrevenueatrisk": 2600, "assistedconversions30d": 410 }, "verification": { "verifiedbotchecked": true, "samplingflag": false, "seasonalityadjusted": true }, "dedupkey": "footwear:categoryv3:clickscliff", "firstchecks": [ "diff canonical tags vs last deploy", "check index coverage for categoryv3", "confirm no robots.txt change in last 24h" ], "links": { "dashboard": "...", "gsc_query": "...", "runbook": "..." } }
The fields that matter most operationally: dedupkey, conversionimpact, and first_checks. The first kills duplicate noise. The second decides who gets woken up. The third turns the alert into a starting point instead of a mystery.
The Conversion Impact Score (transparent, with numbers)
Alerts get ignored because severity gets assigned by size of the drop instead of size of the consequence. A 60% click drop on a page that never converts is a SEV4. A 20% drop on a high-intent checkout-adjacent page might be a SEV1.
CIS = 100 ( 0.40 normalizedrevenueexposure + 0.25 magnitudefactor + 0.20 intentweight + 0.15 * confidence_factor )
-
normalizedrevenueexposure = (estdailyrevenueatrisk / reference_revenue), capped at 1.0. Reference revenue is a tunable anchor — e.g. your 90th-percentile page daily revenue.
-
magnitudefactor = min(abs(deltapct) / 50, 1.0). A 50%+ drop maxes this out.
-
intent_weight = mapped value for the page's intent tier (transactional 1.0, commercial 0.7, informational 0.4, nav 0.2).
-
confidence_factor = 1.0 if verified-bot-checked, non-sampled, and seasonality-adjusted; drops toward 0 as those conditions fail.
Worked example
Take /category/running-shoes:
-
estdailyrevenueatrisk = $2,600; reference_revenue = $3,200 → exposure = 0.81
-
delta = −38.7% → magnitude = 0.77
-
transactional tier → intent = 1.0
-
verified, non-sampled, seasonality-adjusted → confidence = 1.0
CIS = 100 (0.400.81 + 0.250.77 + 0.201.0 + 0.151.0) = 100 (0.324 + 0.193 + 0.20 + 0.15) = 100 * 0.867 = 86.7 → SEV1
Now the same 38.7% drop on /guide/how-to-lace-shoes:
-
revenue exposure ≈ 0.05
-
magnitude = 0.77
-
informational → intent = 0.4
-
confidence = 1.0
CIS = 100 (0.400.05 + 0.250.77 + 0.200.4 + 0.151.0) = 100 (0.02 + 0.193 + 0.08 + 0.15) = 44.3 → SEV3
Same raw drop, wildly different urgency. The mistake most teams make is treating delta magnitude as the headline — it should be the smallest-weighted meaningful input.
Severity → team → SLA mapping
Once CIS produces a severity, routing should be mechanical. No human deciding "is this urgent." The map below is a reasonable default.
| Severity | CIS range | Routing | Response SLA | Channel |
|---|---|---|---|---|
| SEV1 | ≥ 80 | Page on-call SEO eng + notify lead | Ack 15 min | PagerDuty high |
| SEV2 | 60–79 | Assign ticket, notify owner team | Ack 2h, start same day | PagerDuty low + Slack |
| SEV3 | 40–59 | Ticket to backlog, daily digest | Next business day | Slack digest |
| SEV4 | < 40 | Log only, weekly review | Weekly | Dashboard |
A PagerDuty-style payload for SEV1/SEV2 maps directly from the canonical schema:
routingkey: <pdkeyforownerteam> eventaction: trigger dedupkey: <dedupkey> payload.summary: "[SEV1] clicks cliff /category/running-shoes -38.7% CIS86" payload.severity: critical payload.customdetails: <conversionimpact + first_checks>
For issue-tracker tickets (SEV2–SEV3), auto-populate the title, the firstchecks list as a task checklist, and the runbook link. The dedupkey becomes the idempotency key so re-fires update the existing ticket instead of spawning new ones.
False-positive suppression and deduplication
This is where noisy systems actually get fixed. A few heuristics that cut alert volume the hardest:
-
Dedup window by key. If a
dedupkeyfired in the last N hours, update the existing incident rather than opening a new one. One deploy that touches 40 URLs incategoryv3should be one incident, not 40 pages. -
Correlated-cause collapse. If an indexed-count drop, a canonical flip, and a clicks cliff all fire for the same template within an hour, merge them — they're almost certainly the same root cause. Emit the highest-severity parent and attach the rest as evidence.
-
Suppress during known windows. Deploy freezes, data-delay windows (GSC lags ~2–3 days; don't alert on incomplete days), and planned migrations should mute or downgrade.
-
Hysteresis. Require the condition to hold across two consecutive evaluation windows before escalating a borderline SEV3/SEV2. Single-window spikes resolve themselves more often than not.
-
Baseline-poisoning guard. Exclude previously-alerted anomaly days from the baseline so a past incident doesn't skew future comparisons.
The biggest single win: correlation over the template dimension. Teams that group alerts by template or cluster instead of by URL routinely cut incident count by half or more without missing a single real issue.
Verified-bot verification (don't skip this)
A surprising share of "Googlebot traffic changed" alerts are actually fake crawlers or scraper spikes. Before any crawl or bot-based alert escalates, verify:
-
Reverse-DNS the IP (
crawl-.googlebot.com,.google.com). -
Forward-confirm the hostname resolves back to the original IP.
-
Cross-check against published Googlebot IP ranges (Google now publishes these as JSON).
-
Flag user-agent-only matches as unverified and downgrade their confidence_factor.
Set verifiedbotchecked: true in the payload only after forward-confirmed reverse DNS passes. Any crawl-spike alert from unverified bots should never reach SEV1 — it's almost always a scraper, and paging someone for a scraper at 3am is how you lose the team's trust in the whole system.
Integration endpoints and fields
Keep the mapping explicit so nobody guesses which field feeds which signal.
-
GSC (Search Analytics API)
searchanalytics.query→ dimspage,query,date; metricsclicks,impressions,ctr,position. Index Coverage / URL Inspection API →coverageState,indexingState,lastCrawlTime. -
GA4 (Data API)
runReport→ dimensionslandingPagePlusQueryString,sessionDefaultChannelGroup=Organic Search; metricssessions,conversions,purchaseRevenue,totalRevenue. This feedsestdailyrevenueatrisk. -
CDN / logs (Cloudflare, Fastly, Akamai log push) fields
clientIP,userAgent,status,host,uri,cacheStatus. Feeds crawl-waste, 5xx, and verified-bot checks.
One practical note: GA4 sampling and GSC's data delay are the two most common causes of phantom alerts. Always set sampling_flag based on GA4's response metadata, and don't alert on GSC data from the trailing 2–3 days.
SLOs, KPIs and dashboard definitions
Your alerting system needs its own SLOs, or it slowly degrades without anyone noticing.
-
Alert precision = true incidents / total alerts fired. Target ≥ 0.80 for SEV1/SEV2. Below that, tighten thresholds or suppression.
-
Mean time to acknowledge (MTTA) for SEV1
target < 15 min.
-
Mean time to detect (MTTD) for revenue-impacting drops
target < 24h from first signal.
-
False-positive rate on crawl/bot alerts
target < 10% after verified-bot filtering.
-
Coverage = % of organic revenue covered by at least one CIS-weighted rule. Target ≥ 90% of top-revenue templates.
Dashboard metric definitions worth standardizing:
-
Revenue-at-risk (open)
sum of
estdailyrevenueatriskacross unresolved SEV1/SEV2. -
Alert-to-incident ratio
fired alerts ÷ confirmed incidents (your noise gauge).
-
Suppression hit rate
% of candidate alerts killed by dedup/correlation (shows how much noise you're absorbing).
Dashboard metric definitions worth standardizing are useful for tracking how the system evolves and where to tune suppression.
A real scenario
A mid-market outdoor-gear retailer — around 1.3M organic sessions/month — had alerting that fired roughly 120 times a week into a Slack channel everyone had muted. During a template deploy, a canonical flip quietly pointed about 300 category URLs at a parent page. Clicks started bleeding, but the real signal was buried under dozens of low-volume informational-page alerts firing the same day.
They rebuilt around three changes: volume floors, template-level correlation, and CIS-based severity. After that, the same deploy would have produced a single SEV1 incident — "category_v3 canonical flip, ~$2.6k/day at risk, CIS 86" — instead of 40 scattered page alerts. Weekly alert volume dropped to somewhere in the 12–18 range, and precision on the alerts that did fire climbed past 80%. Nothing about their detection logic changed. They just stopped forwarding signals and started shipping decisions.
When this setup makes sense — and when it doesn't
Worth building if organic drives meaningful revenue, you have GSC + GA4 + log access joined reasonably well, and you're already drowning in low-trust alerts. The payoff shows up almost entirely in trust and response time.
Not worth it yet if your GSC/GA4 joins are unreliable. CIS is only as good as the revenue numbers feeding it, and a wrong estdailyrevenueatrisk will mis-page people and burn credibility fast. Fix data lineage first.
Who should skip this entirely: very small sites where someone eyeballs Search Console a couple times a week. At that scale the overhead of maintaining rule libraries and SLOs outweighs the benefit. Manual review is genuinely fine until organic volume and template count make it impossible to hold in your head.
The hard part of SEO alerting was never detecting anomalies. It's deciding which anomalies deserve a human's attention, routing them with enough context to act on, and ruthlessly suppressing the rest. Get the scoring and suppression right, and your alerts stop being noise people mute — and start being the thing they actually check first.
Ready to elevate your search rankings?
Join 5,000+ businesses using GoSeofy to increase organic traffic, optimize content, and outperform competitors online.