



Most teams treat Core Web Vitals like a report card. Someone runs a scan quarterly, screenshots the green numbers, and moves on. The problem is CWV isn't a static score — it drifts every time engineering ships a new hero image, a third-party chat widget, or an analytics tag that's supposedly lightweight but isn't. And the drift almost never shows up in lab tests, because your dev's MacBook on office fiber renders everything fine.
Where it actually bites is field data. Your synthetic checks stay green while real users on mid-range Android phones start seeing LCP creep from 2.3s to 3.1s. Google's ranking signal uses field data, not your Lighthouse run. By the time rankings soften on a few money categories, the regression has been live for three weeks and nobody can pinpoint which deploy caused it.
This post is narrow on purpose. It's about wiring Core Web Vitals SEO governance into your deployment process — rollback gates tied to CWV thresholds, sensible synthetic and RUM sampling rules, prioritizing pages that actually drive organic conversions, and the dashboards and alerting that make all of it operational instead of aspirational.
Why CWV regressions slip past everyone
The core issue is that the people who ship the regression and the people who feel the pain are on different teams, looking at different data, on different timelines.
Engineering ships against lab metrics. Lab data is deterministic and fast to check in CI. But lab LCP and field LCP routinely diverge by a full second or more, especially on template pages where render depends on user connection, device CPU, and cache state. A change that looks fine in CI can degrade the 75th percentile field score for a specific device class you don't test on.
Then there's the lag. Google's Chrome UX Report data (and your own RUM) is a rolling 28-day window. That smoothing is great for stability and terrible for attribution. A bad deploy on the 3rd doesn't fully express in the p75 until well into the month, and by then you've shipped forty other things. Trying to figure out which change caused it becomes archaeology.
The last piece is prioritization. Teams monitor CWV sitewide — one aggregate number for the whole domain. That average hides the fact that your top 200 organic landing pages, the ones responsible for most of your conversions, might be quietly getting worse while the sitewide average stays flat because thousands of low-traffic pages are fine. You're watching the wrong denominator.
Rollback gates: make CWV a deploy blocker, not a dashboard
The single highest-leverage change is moving CWV from "thing we look at" to "thing that can stop a release." This is the same discipline behind any solid technical SEO migration playbook with rollback criteria — you decide the failure conditions before you ship, not after traffic drops.
Stop losing visibility in search results.
GoSeofy helps you monitor, analyze, and improve your SEO performance with ease.
- Comprehensive keyword tracking
- Backlink quality monitoring
- Real-time SEO performance reports
No credit card required
A rollback gate works in two layers.
Layer 1 — pre-deploy (lab, blocking): Run Lighthouse or a headless test against your critical page templates in CI. Set budgets, not aspirations. If a PR pushes the product template's LCP element past a byte or timing budget, the build fails. This won't catch everything, but it catches the obvious offenders — the 900KB hero, the render-blocking font swap, the synchronous third-party script.
Layer 2 — post-deploy (field, alerting + auto-rollback trigger): After a release, watch RUM for the affected page group over a short verification window. If the fast-moving field signal breaches your threshold, you flag the deploy for rollback. You can't wait 28 days here, so you use a shorter comparison window (more on sampling below).
Here's a realistic budget structure teams actually hold engineering to:
| Metric | Lab budget (CI, blocking) | Field p75 SLA (RUM) | Rollback trigger |
|---|---|---|---|
| LCP | ≤ 2.2s on throttled 4G/mid-CPU | ≤ 2.5s | p75 > 2.8s sustained 48h on priority pages |
| INP | ≤ 180ms | ≤ 200ms | p75 > 260ms sustained 48h |
| CLS | ≤ 0.08 | ≤ 0.10 | p75 > 0.15 on any priority template |
The gap between the lab budget and the field SLA is intentional — you leave headroom because field conditions are always worse than the lab. If you set your CI budget equal to the Google threshold, you'll ship things that pass CI and fail in the wild.
One mistake worth calling out: teams set gates only on LCP because it's the metric everyone talks about. INP is the one that quietly wrecks e-commerce and SaaS marketing pages, because it's driven by JavaScript execution — exactly the stuff that accumulates deploy after deploy. Gate all three.
Sampling rules: synthetic and RUM do different jobs
People argue about synthetic vs. RUM like it's either/or. It isn't. They answer different questions and you need both.
Synthetic (lab) is for detection and attribution. It's controlled, repeatable, and you can run it on every deploy. It tells you what changed and roughly when. The tradeoff is it doesn't reflect your real user distribution — one device profile, one network condition, one cache state.
RUM (field) is for truth and ranking impact. It's what Google actually measures, weighted by your real traffic mix. The tradeoff is volume and noise: low-traffic pages don't collect enough samples to say anything meaningful, and the data is delayed.
-
Synthetic run on every deploy for your priority templates only (not every URL — that's wasteful). Add a nightly full-template sweep so you catch slow drift on secondary pages.
-
RUM sample at a rate that gives you statistically usable numbers on your priority pages within a 3–7 day window. High-traffic templates can be sampled lightly (say 10–20%) and still hit sample size. Low-traffic-but-high-value pages need a higher sample rate — sometimes 100% — or they'll never accumulate enough events to trip an alert.
That last point is the one most people miss. Uniform sampling under-serves your important-but-lower-traffic pages. A category page that drives strong conversion but modest sessions might collect too few INP samples to detect a regression at a 10% rate. Weight your sampling by business value, not just by traffic.
Weight your sampling by business value, not just by traffic.
For anything requiring statistical confidence — like deciding whether a regression is real or noise — define your minimum sample size and comparison window before you look at the numbers. Otherwise you're eyeballing a two-day dip and rolling back a perfectly good deploy.
Prioritize by pages that drive organic conversions
Sitewide CWV averages are close to useless for governance. What matters is the CWV health of the specific URLs that rank, get organic traffic, and convert.
Build a priority list by joining three things:
-
Organic landing pages from Search Console (impressions + clicks)
-
Conversion data from analytics attributed to those landing pages
-
Current field CWV per page group / template
Then rank pages by organic-attributed revenue or conversions, and layer their CWV status on top. Now you can see what actually matters: which high-value pages are failing or trending toward failure.
A typical example looks like this. A mid-size e-commerce site has maybe 40,000 indexable URLs. Their sitewide "good CWV" rate sits around 82%, which looks healthy. But when you filter to the roughly 180 landing pages generating the bulk of organic revenue, only about two-thirds are passing INP, and three of the top ten converting category pages have crept over the threshold after a faceted-filter UI update. The aggregate hid it completely. Fixing those ten pages moves more revenue than fixing the other 39,990 combined.
This is why your monitoring should be conversion-weighted, not URL-weighted. A regression on a page doing 4% conversion and thousands of organic sessions is a P1. The same regression on a page nobody lands on from search is a backlog ticket.
Building the dashboard and alerting layer
The dashboard's whole job is to answer one question fast: did a recent deploy hurt CWV on pages that matter, and which deploy was it?
A workable dashboard has four panels:
-
Priority page CWV trend — p75 LCP/INP/CLS for your top converting templates, plotted over time with deploy markers overlaid. The deploy markers are the important part; without them you can't correlate a regression to a release.
-
Regression watchlist — any priority page group that crossed from "good" toward "needs improvement" in the current window, sorted by attributed conversions.
-
Synthetic vs. field gap — where lab says fine but field says bad. A widening gap means your CI budgets are too loose for real conditions.
-
Sample coverage — which priority pages don't yet have enough RUM samples to trust. Stops you from acting on noise.
For alerting, tier it so people don't drown:
-
P1 (page) a top-converting template breaches its rollback trigger → page the on-call and flag the suspect deploy for rollback review.
-
P2 (Slack) a priority page trends toward the threshold or the synthetic/field gap widens sharply → ticket, investigate this sprint.
-
P3 (digest) slow drift on secondary pages → weekly review.
The trap is alerting on the raw 28-day p75. It's too slow to trigger a rollback and too smoothed to catch a fresh regression. Use a shorter rolling window (with adequate sampling) for fast alerts, and keep the 28-day view for reporting and trend confirmation.
Wiring alerts to named owners instead of a shared channel nobody reads is what makes this stick. Every priority template should have someone responsible for the P1/P2, the same way you'd assign ownership in any SEO ops playbook with SLAs and ticket templates. An unassigned alert is just decoration.
A workflow that ties it together
[PR opened on priority template] ↓ [CI runs synthetic CWV against lab budgets] ↓ Pass? → Deploy ships + deploy marker written to dashboard Fail? → Build blocked / waiver requested (logged, with owner) ↓ [Verification window opens for affected page group] [RUM sampling ramps to trusted-sample level] ↓ Field signal OK? → Close window, monitor normally Field breaches rollback trigger? → P1 alert fires with suspect deploy attached ↓ [Owner reviews] Real regression → roll back or hotfix Noise / insufficient sample → dismiss with note ↓ [Weekly digest: review slow drift + recalibrate budgets]
Writing deploy markers automatically is the part that matters most for attribution. Almost every hard CWV debugging session is really a "which of these 30 changes did it" problem, and a timeline with deploy markers cuts that from days to minutes.
A simple visualization of the end-to-end workflow helps teams understand attribution.
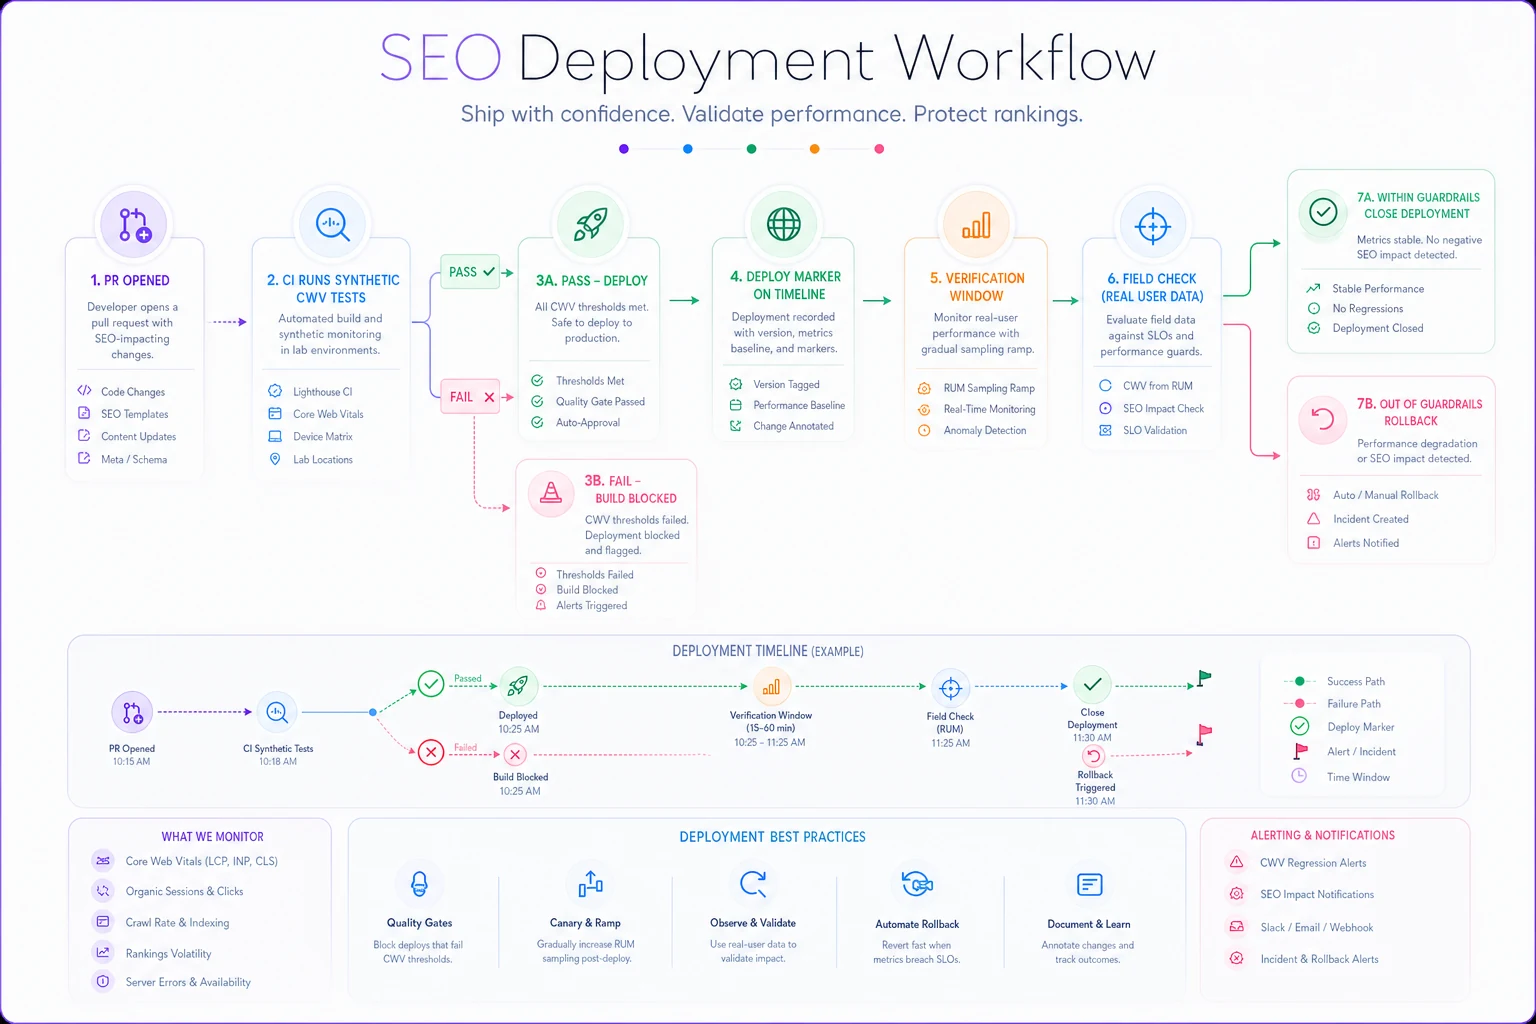
The numbered steps below show the practical sequence teams follow.
-
Developer opens a PR touching a priority template. CI runs synthetic CWV against the lab budgets.
-
Build fails if a budget is breached. Developer fixes or requests an explicit budget waiver (logged, with an owner).
-
Deploy ships. A deploy marker is written to the CWV dashboard automatically.
-
Verification window opens for the affected page group. RUM sampling ramps to trusted-sample level for those pages.
-
If the field signal breaches the rollback trigger within the window, the P1 alert fires with the suspect deploy attached.
-
Owner reviews. Real regression → roll back or hotfix. Noise / insufficient sample → dismiss with a note.
-
Weekly digest reviews slow drift and the synthetic-vs-field gap to recalibrate budgets.
Writing deploy markers automatically is the part that matters most for attribution. Almost every hard CWV debugging session is really a "which of these 30 changes did it" problem, and a timeline with deploy markers cuts that from days to minutes.
When this level of governance makes sense — and when it doesn't
When it makes sense: you ship frequently, you have templates that serve thousands of URLs each, and organic drives meaningful revenue. High deploy frequency plus template-based scale is exactly the situation where one bad change silently degrades hundreds of ranking pages at once. That's the profile where rollback gates pay for themselves.
When it's overkill: a small site with a handful of pages, infrequent releases, and low deploy velocity. If you ship monthly and have 25 pages, a quarterly manual CWV review plus a simple pre-deploy check is plenty. Building rollback gates and RUM sampling tiers for that is process for its own sake.
Who should hold off on this for now: teams without reliable RUM data collection in place. If your field data is thin or untrustworthy, fix that first — governance built on bad measurement just automates wrong decisions. Get clean, sampled, page-grouped RUM flowing before you attach rollback triggers to it.
A quick real scenario
A regional home-goods retailer running a headless storefront kept passing sitewide CWV but noticed a slow, unexplained softening on several high-intent category pages over a quarter. Their aggregate INP looked fine — around the "good" band — so nobody flagged it.
When they rebuilt monitoring to focus on the top roughly 150 organic-converting templates and overlaid deploy markers, the pattern became obvious: a filter/sort component shipped mid-quarter had pushed INP on those category pages from around 190ms to the 250–270ms range on mobile. It never surfaced in the sitewide number because it only affected a subset of heavily-filtered pages.
They set a rollback trigger on those templates, hotfixed the component's event handlers, and INP settled back under 200ms within a couple of weeks of field data collecting. The category pages recovered their previous ranking positions over the following month. The fix itself touched a handful of templates rather than the whole catalog. The win wasn't the fix — it was finally being able to see the regression against the pages that mattered, when it mattered.
Wrapping up
The shift that makes Core Web Vitals actually useful for SEO is moving it out of the reporting pile and into the deploy pipeline. Set lab budgets that block bad PRs. Leave headroom between lab budgets and field SLAs. Sample RUM by business value so your important pages have enough data to trip an alert. Prioritize by organic conversions, not by URL count. And overlay deploy markers so a regression points straight at the release that caused it.
None of this requires exotic tooling. It requires deciding, ahead of time, what "too slow" means for the pages that pay the bills — and giving someone the authority to stop a release when a deploy crosses that line. That's the part most teams skip, and it's exactly why the same regressions keep slipping through.
Ready to elevate your search rankings?
Join 5,000+ businesses using GoSeofy to increase organic traffic, optimize content, and outperform competitors online.