

Marketing teams dump millions into SEO without knowing which efforts actually drive revenue. You're tracking rankings, measuring traffic, watching conversions—but can't connect the dots between that blog post from six months ago and today's enterprise deal. The tools exist, the data exists, but most teams are stuck with disconnected dashboards that answer the wrong questions.
The pattern repeats constantly: everyone has data, nobody has answers. GSC shows impressions, GA4 tracks sessions, your CRM logs deals, but connecting "keyword clicked" to "revenue generated" requires engineering work that most marketing teams never get around to prioritizing.
The real problem isn't lack of data—it's lack of pipeline architecture. Marketing teams need production-grade data infrastructure, not another dashboard. That means SQL models that actually join your data sources, sampling strategies that balance cost with accuracy, and alerting rules that catch attribution breaks before they corrupt your reporting.
Why traditional attribution breaks at the data layer
Attribution fails because marketing data lives in silos that were never designed to talk to each other. Google Search Console knows what keywords drove clicks but has no concept of revenue. GA4 tracks user behavior but loses context after conversion. Your CRM knows deal value but can't trace back to organic search touchpoints.
Most teams try solving this with UTM parameters and conversion tracking, which captures maybe 30% of the attribution story. A visitor searches "enterprise automation software," clicks your ranking, browses three blog posts, leaves, comes back direct two weeks later, downloads a whitepaper, gets retargeted, clicks an ad, signs up for a trial, then converts six weeks later. Good luck attributing that revenue to the original SEO click.
The technical challenge compounds at scale. A mid-size Saa company might generate 50,000 organic sessions monthly across 2,000 ranking pages. Each session creates dozens of events. Your CRM tracks hundreds of touchpoints per lead. Joining this data means processing millions of rows daily, and a single bad join can corrupt months of attribution data.
Here's what a broken attribution pipeline looks like in practice:
| Data Source | What It Knows | What It Misses | Join Complexity |
|---|---|---|---|
| GSC | Keywords, clicks, impressions | User identity, conversion data | Medium - API limits |
| GA4 | Sessions, pages, events | Cross-device journeys, offline conversion | High - sampling issues |
| Server Logs | Every request, bot traffic | User intent, conversion value | Very High - volume |
| CRM | Deals, revenue, contacts | Original traffic source, content journey | High - identity matching |
| CDN Logs | Edge performance, geographic data | User behavior, conversion | Medium - format parsing |
The infrastructure debt accumulates fast. Teams start with manual exports, graduate to scheduled reports, then realize they need streaming pipelines. By the time they've built something workable, the business has pivoted, the data model has changed, or Google has deprecated another API.
Core SQL models that actually connect SEO to revenue
Building attribution means writing SQL that survives production. Not elegant queries that impress data scientists—practical joins that run daily without breaking. The foundation starts with three core models that transform raw data into attribution intelligence.
Stop losing visibility in search results.
GoSeofy helps you monitor, analyze, and improve your SEO performance with ease.
- Comprehensive keyword tracking
- Backlink quality monitoring
- Real-time SEO performance reports
No credit card required
Model 1: GSC to GA4 Landing Page Bridge
``sql
WITH gscdaily AS (
SELECT
date,
page AS landingpage,
query AS searchquery,
SUM(clicks) AS totalclicks,
AVG(position) AS avgposition,
SUM(impressions) AS totalimpressions
FROM project.dataset.searchconsoleexport
WHERE date >= DATESUB(CURRENTDATE(), INTERVAL 90 DAY)
AND country = 'usa'
GROUP BY 1, 2, 3
),
ga4sessions AS (
SELECT
PARSEDATE('%Y%m%d', eventdate) AS date,
(SELECT value.stringvalue FROM UNNEST(eventparams) WHERE key = 'pagelocation') AS landingpage,
userpseudoid,
gasessionid,
MAX(CASE WHEN eventname = 'purchase' THEN 1 ELSE 0 END) AS converted,
SUM(CASE WHEN eventname = 'purchase' THEN ecommerce.purchaserevenue ELSE 0 END) AS revenue
FROM project.dataset.events*
  WHERE TABLESUFFIX BETWEEN FORMATDATE('%Y%m%d', DATESUB(CURRENTDATE(), INTERVAL 90 DAY))
    AND FORMATDATE('%Y%m%d', CURRENTDATE())
    AND trafficsource.source = 'google'
    AND trafficsource.medium = 'organic'
  GROUP BY 1, 2, 3, 4
)

SELECT
  gsc.date,
  gsc.landingpage,
  gsc.searchquery,
  gsc.totalclicks AS gscclicks,
  COUNT(DISTINCT ga.userpseudoid) AS gausers,
  COUNT(DISTINCT ga.gasessionid) AS gasessions,
  SUM(ga.converted) AS conversions,
  SUM(ga.revenue) AS attributedrevenue,
  SAFEDIVIDE(SUM(ga.revenue), gsc.totalclicks) AS revenueperclick
FROM gscdaily gsc
LEFT JOIN ga4sessions ga
  ON gsc.date = ga.date
  AND REGEXPREPLACE(gsc.landingpage, r'https?://[^/]+', '') =
     REGEXPREPLACE(ga.landingpage, r'https?://[^/]+', '')
GROUP BY 1, 2, 3, 4
HAVING gscclicks > 5  -- Filter noise
ORDER BY attributedrevenue DESC
``
This model handles the URL matching nightmare between GSC and GA4. Google reports URLs differently across platforms—GSC might show https://site.com/page while GA4 records https://site.com/page?utmsource=google. The REGEXPREPLACE strips protocol and domain variations to create reliable joins.
Model 2: Multi-touch Attribution Chain
``sql
WITH usertouchpoints AS (
SELECT
userpseudoid,
eventtimestamp,
eventname,
(SELECT value.stringvalue FROM UNNEST(eventparams) WHERE key = 'pagelocation') AS page,
(SELECT value.stringvalue FROM UNNEST(eventparams) WHERE key = 'pagereferrer') AS referrer,
trafficsource.source AS sessionsource,
trafficsource.medium AS sessionmedium,
ROWNUMBER() OVER (PARTITION BY userpseudoid ORDER BY eventtimestamp) AS touchnumber,
LAG(eventtimestamp) OVER (PARTITION BY userpseudoid ORDER BY eventtimestamp) AS prevtouchtime
FROM project.dataset.events
WHERE TABLESUFFIX BETWEEN FORMATDATE('%Y%m%d', DATESUB(CURRENTDATE(), INTERVAL 180 DAY))
AND FORMATDATE('%Y%m%d', CURRENTDATE())
),
conversionevents AS (
SELECT
userpseudoid,
eventtimestamp AS conversiontime,
ecommerce.purchaserevenue AS revenue,
(SELECT value.stringvalue FROM UNNEST(eventparams) WHERE key = 'transactionid') AS transactionid
FROM project.dataset.events
WHERE TABLESUFFIX BETWEEN FORMATDATE('%Y%m%d', DATESUB(CURRENTDATE(), INTERVAL 180 DAY))
AND FORMATDATE('%Y%m%d', CURRENTDATE())
AND eventname = 'purchase'
AND ecommerce.purchaserevenue > 0
),
attributedjourneys AS (
SELECT
c.transactionid,
c.revenue,
t.userpseudoid,
t.page,
t.sessionsource,
t.sessionmedium,
t.touchnumber,
TIMESTAMPDIFF(c.conversiontime, t.eventtimestamp, HOUR) AS hoursbeforeconversion,
CASE
WHEN t.touchnumber = 1 THEN 'firsttouch'
WHEN t.eventtimestamp = MAX(t.eventtimestamp) OVER (PARTITION BY c.transactionid) THEN 'lasttouch'
ELSE 'midjourney'
END AS attributionposition
FROM conversionevents c
JOIN usertouchpoints t
ON c.userpseudoid = t.userpseudoid
AND t.eventtimestamp <= c.conversiontime
AND t.eventtimestamp >= TIMESTAMPSUB(c.conversiontime, INTERVAL 90 DAY)
)
SELECT
attributionposition,
sessionsource,
sessionmedium,
COUNT(DISTINCT transactionid) AS conversions,
SUM(revenue) AS totalrevenue,
AVG(hoursbeforeconversion) AS avghourstoconvert,
APPROXQUANTILES(hoursbeforeconversion, 100)[OFFSET(50)] AS medianhourstoconvert
FROM attributedjourneys
WHERE sessionmedium = 'organic'
GROUP BY 1, 2, 3
ORDER BY totalrevenue DESC
``
This model reveals the actual contribution of SEO across the customer journey. Most teams discover their "direct" traffic is largely returning organic visitors who first found them through search.
Model 3: CRM Revenue Reconciliation
``sql
WITH crmdeals AS (
SELECT
dealid,
contactemail,
closedate,
amount AS dealvalue,
pipelinestage,
leadsource,
firsttouchdate
FROM project.dataset.salesforceopportunities
  WHERE closedate >= DATESUB(CURRENTDATE(), INTERVAL 365 DAY)
    AND pipelinestage = 'Closed Won'
),

emailtoga AS (
  SELECT DISTINCT
    userpseudoid,
    (SELECT value.stringvalue FROM UNNEST(eventparams) WHERE key = 'email') AS email,
    MIN(eventtimestamp) AS firstseen,
    MAX(eventtimestamp) AS lastseen
  FROM
project.dataset.events
WHERE TABLESUFFIX BETWEEN FORMATDATE('%Y%m%d', DATESUB(CURRENTDATE(), INTERVAL 365 DAY))
AND FORMATDATE('%Y%m%d', CURRENTDATE())
AND eventname IN ('signup', 'formsubmit', 'generatelead')
GROUP BY 1, 2
HAVING email IS NOT NULL
),
organicattribution AS (
SELECT
eg.email,
eg.userpseudoid,
MIN(CASE WHEN trafficsource.medium = 'organic' THEN eventtimestamp END) AS firstorganictouch,
COUNT(DISTINCT CASE WHEN trafficsource.medium = 'organic' THEN gasessionid END) AS organicsessions,
STRINGAGG(DISTINCT
CASE WHEN trafficsource.medium = 'organic'
THEN (SELECT value.stringvalue FROM UNNEST(eventparams) WHERE key = 'pagelocation')
END, ' | ' LIMIT 10) AS organicpages
FROM emailtoga eg
JOIN project.dataset.events e
ON eg.userpseudoid = e.userpseudoid
WHERE TABLESUFFIX BETWEEN FORMATDATE('%Y%m%d', DATESUB(CURRENTDATE(), INTERVAL 365 DAY))
AND FORMATDATE('%Y%m%d', CURRENTDATE())
GROUP BY 1, 2
)
SELECT
DATETRUNC(cd.closedate, MONTH) AS closemonth,
COUNT(DISTINCT cd.dealid) AS totaldeals,
COUNT(DISTINCT CASE WHEN oa.firstorganictouch IS NOT NULL THEN cd.dealid END) AS organicinfluenceddeals,
SUM(cd.dealvalue) AS totalrevenue,
SUM(CASE WHEN oa.firstorganictouch IS NOT NULL THEN cd.dealvalue ELSE 0 END) AS organicinfluencedrevenue,
AVG(CASE WHEN oa.firstorganictouch IS NOT NULL THEN oa.organicsessions END) AS avgorganicsessionsperdeal
FROM crmdeals cd
LEFT JOIN organicattribution oa
ON LOWER(cd.contactemail) = LOWER(oa.email)
GROUP BY 1
ORDER BY 1 DESC
``
This query finally answers "how much revenue did SEO generate?" Not clicks, not sessions, not even conversions—actual closed revenue tied back to organic search touchpoints.
Sampling strategies and latency trade-offs that keep costs manageable
Processing every event gets expensive fast. A typical e-commerce site with 100,000 daily sessions generates roughly 5 million events monthly. At BigQuery on-demand pricing, scanning that data repeatedly costs thousands per month. Smart sampling cuts costs dramatically while maintaining attribution accuracy.
The key is knowing which data needs complete capture versus statistical sampling. Revenue events? Process everything. Page views? Sample intelligently. Here's a practical approach:
``sql
-- Deterministic sampling that maintains user journeys
WITH sampledusers AS (
SELECT DISTINCT userpseudoid
FROM project.dataset.events
  WHERE TABLESUFFIX = FORMATDATE('%Y%m%d', CURRENTDATE())
    AND MOD(FARMFINGERPRINT(userpseudoid), 100) < 10  -- 10% sample
),

fulljourneys AS (
  SELECT e.
FROM project.dataset.events e
JOIN sampledusers s ON e.userpseudoid = s.userpseudoid
WHERE TABLESUFFIX BETWEEN FORMATDATE('%Y%m%d', DATESUB(CURRENTDATE(), INTERVAL 30 DAY))
AND FORMATDATE('%Y%m%d', CURRENTDATE())
)
SELECT
eventdate,
COUNT() 10 AS estimatedevents, -- Scale up by sampling rate
COUNT(DISTINCT userpseudoid) 10 AS estimatedusers
FROM full_journeys
GROUP BY 1
``
The FARM_FINGERPRINT ensures the same users get sampled consistently, preserving attribution chains.
-
Tier 1 (Real-time)
Critical conversion events, process immediately
-
Tier 2 (Hourly)
Session-level aggregations, 25% sample
-
Tier 3 (Daily)
Full attribution modeling, 10% sample for exploration, 100% for revenue events
-
Tier 4 (Weekly)
Complete reprocessing for accuracy validation
Latency is really a business decision. An agency managing 50 clients can't wait 24 hours for attribution data—they need hourly updates showing which content drives pipeline. But that same agency probably doesn't need millisecond-accurate visitor counts.
Alerting rules that catch attribution breaks before reports go sideways
Attribution pipelines break silently. A developer changes the GA4 configuration, your SQL starts returning nulls, and nobody notices until the CEO asks why SEO revenue dropped 90% overnight. It didn't—your tracking broke.
``sql
-- Daily data quality checks
WITH dailymetrics AS (
SELECT
CURRENTDATE() AS checkdate,
-- Check 1: GSC data freshness
DATEDIFF(CURRENTDATE(), MAX(date), DAY) AS gscdaysbehind,
-- Check 2: GA4 event volume
(SELECT COUNT() FROM project.dataset.events
     WHERE TABLESUFFIX = FORMATDATE('%Y%m%d', DATESUB(CURRENTDATE(), INTERVAL 1 DAY))) AS yesterdayevents,

    -- Check 3: Join rate between GSC and GA4
    (SELECT COUNT() FROM gscdaily WHERE date = DATESUB(CURRENTDATE(), INTERVAL 3 DAY)) AS gscrecords,
    (SELECT COUNT() FROM ga4sessions WHERE date = DATESUB(CURRENTDATE(), INTERVAL 3 DAY)) AS gamatches,

    -- Check 4: Revenue tracking
    (SELECT SUM(revenue) FROM attributedjourneys WHERE DATE(conversiontime) = DATESUB(CURRENTDATE(), INTERVAL 1 DAY)) AS yesterdayrevenue,

    -- Check 5: NULL rate in critical fields
    (SELECT COUNTIF(userpseudoid IS NULL) / COUNT() FROM ga4sessions) AS nulluserrate
)

SELECT
  checkdate,
  CASE WHEN gscdaysbehind > 3 THEN 'ALERT: GSC data is ' || gscdaysbehind || ' days behind' END AS gscalert,
  CASE WHEN yesterdayevents < 1000 THEN 'ALERT: Low event volume: ' || yesterdayevents END AS volumealert,
  CASE WHEN SAFEDIVIDE(gamatches, gscrecords) < 0.5 THEN 'ALERT: Low join rate: ' || ROUND(SAFEDIVIDE(gamatches, gscrecords)  100, 1) || '%' END AS joinalert,
  CASE WHEN yesterdayrevenue IS NULL THEN 'ALERT: No revenue tracked yesterday' END AS revenuealert,
  CASE WHEN nulluserrate > 0.1 THEN 'ALERT: High null rate: ' || ROUND(nulluserrate * 100, 1) || '%' END AS nullalert
FROM dailymetrics
``
Schedule these checks to run every morning at 6 AM. When something breaks, you'll know before the marketing team starts their day.
``sql
-- Week-over-week attribution stability
WITH weeklyattribution AS (
SELECT
DATETRUNC(date, WEEK) AS week,
attributionposition,
SUM(revenue) AS weeklyrevenue,
LAG(SUM(revenue)) OVER (PARTITION BY attributionposition ORDER BY DATETRUNC(date, WEEK)) AS prevweekrevenue
FROM attributedjourneys
GROUP BY 1, 2
)
SELECT
week,
attributionposition,
weeklyrevenue,
prevweekrevenue,
ROUND(SAFEDIVIDE(weeklyrevenue - prevweekrevenue, prevweekrevenue) 100, 1) AS weekoverweekchange,
CASE
WHEN ABS(SAFEDIVIDE(weeklyrevenue - prevweekrevenue, prevweekrevenue)) > 0.5
THEN 'INVESTIGATE: ' || attributionposition || ' attribution changed ' ||
ROUND(SAFEDIVIDE(weeklyrevenue - prevweekrevenue, prevweekrevenue) 100, 0) || '%'
END AS alert
FROM weeklyattribution
WHERE week = DATETRUNC(CURRENTDATE(), WEEK)
AND prevweekrevenue > 0
``
This catches situations where attribution suddenly shifts—like last-touch attribution jumping because your tracking pixel broke and you're only capturing direct conversions.
Experiment attribution recipes that actually isolate SEO impact
Running SEO experiments without proper attribution is like running A/B tests without statistical significance—you're guessing. The challenge with SEO experiments is isolating impact when you can't control all the variables. Unlike paid ads where you can flip campaigns on and off, SEO changes affect rankings gradually and unevenly.
``sql
-- SEO Experiment Attribution Framework
WITH experimentconfig AS (
SELECT
'titletestq3' AS experimentname,
DATE('2024-07-01') AS startdate,
DATE('2024-09-30') AS enddate,
ARRAY['/blog/automation-guide', '/blog/workflow-tips', '/blog/scaling-operations'] AS testpages,
ARRAY['/blog/cost-reduction', '/blog/team-management', '/blog/growth-strategies'] AS controlpages
),
preperiodmetrics AS (
SELECT
CASE
WHEN page IN UNNEST((SELECT testpages FROM experimentconfig)) THEN 'test'
WHEN page IN UNNEST((SELECT controlpages FROM experimentconfig)) THEN 'control'
END AS grouptype,
AVG(clicks) AS baselineclicks,
AVG(impressions) AS baselineimpressions,
AVG(position) AS baselineposition,
AVG(revenueperclick) AS baselinerpc
FROM gsctorevenuemodel
WHERE date BETWEEN DATESUB((SELECT startdate FROM experimentconfig), INTERVAL 60 DAY)
AND DATESUB((SELECT startdate FROM experimentconfig), INTERVAL 1 DAY)
AND (page IN UNNEST((SELECT testpages FROM experimentconfig))
OR page IN UNNEST((SELECT controlpages FROM experimentconfig)))
GROUP BY 1
),
experimentperiodmetrics AS (
SELECT
CASE
WHEN page IN UNNEST((SELECT testpages FROM experimentconfig)) THEN 'test'
WHEN page IN UNNEST((SELECT controlpages FROM experimentconfig)) THEN 'control'
END AS grouptype,
date,
SUM(clicks) AS dailyclicks,
SUM(impressions) AS dailyimpressions,
AVG(position) AS avgposition,
SUM(attributedrevenue) AS dailyrevenue,
COUNT(DISTINCT page) AS pagesingroup
FROM gsctorevenuemodel
WHERE date BETWEEN (SELECT startdate FROM experimentconfig)
AND (SELECT enddate FROM experimentconfig)
AND (page IN UNNEST((SELECT testpages FROM experimentconfig))
OR page IN UNNEST((SELECT controlpages FROM experimentconfig)))
GROUP BY 1, 2
)
SELECT
e.date,
e.grouptype,
e.dailyclicks,
p.baselineclicks,
ROUND((e.dailyclicks - p.baselineclicks) / p.baselineclicks 100, 1) AS clicksliftpct,
e.avgposition,
p.baselineposition,
ROUND(p.baselineposition - e.avgposition, 2) AS positionimprovement,
e.dailyrevenue,
ROUND(e.dailyrevenue - (p.baselinerpc e.dailyclicks), 2) AS incrementalrevenue,
-- Statistical significance using simplified Z-test
CASE
WHEN e.pagesingroup >= 30 AND ABS((e.dailyclicks - p.baselineclicks) / SQRT(p.baselineclicks)) > 1.96
THEN 'Significant'
ELSE 'Not Significant'
END AS statisticalsignificance
FROM experimentperiodmetrics e
JOIN preperiodmetrics p ON e.grouptype = p.grouptype
ORDER BY date DESC, grouptype
``
This model does three things most SEO experiment tracking misses. First, it establishes a proper baseline using pre-experiment data. Second, it includes a control group to account for external factors like algorithm updates or seasonal shifts. Third, it tracks revenue impact—not just ranking changes.
The flow from raw data to experiment results looks roughly like this:
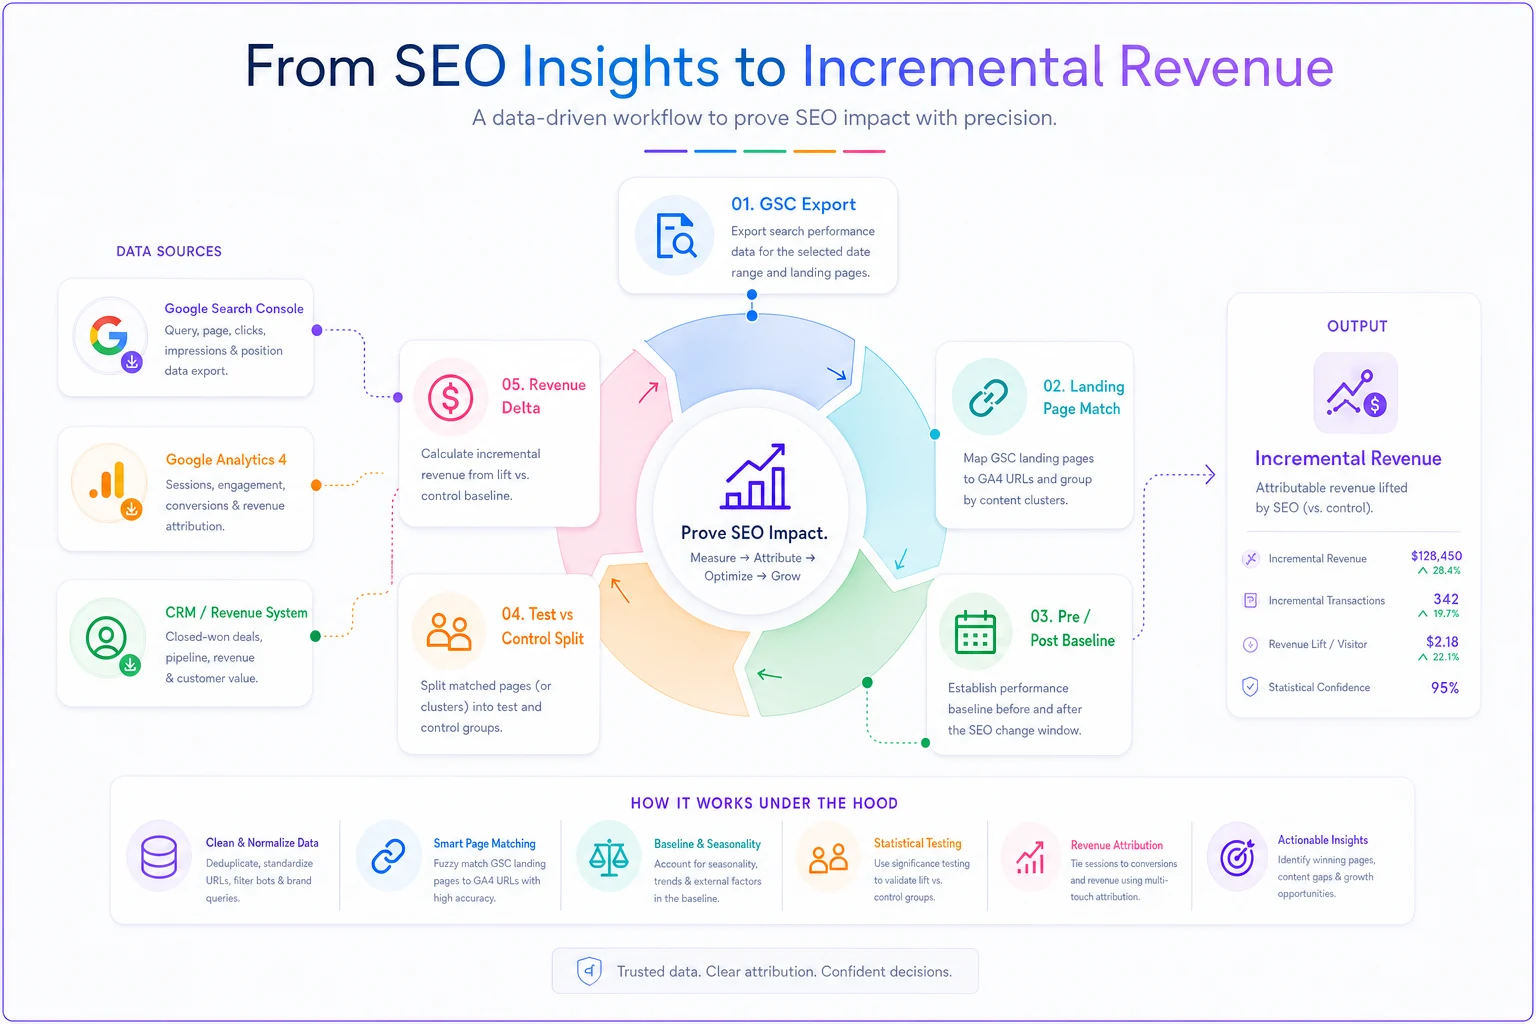
``
GSC Export → Landing Page Match → Pre/Post Baseline → Test vs Control Split → Revenue Delta
``
``sql
-- Content experiment attribution with engagement weighting
WITH contentengagement AS (
SELECT
page,
userpseudoid,
sessionid,
SUM(engagementtimemsec) / 1000 AS engagementseconds,
MAX(CASE WHEN eventname = 'scroll90' THEN 1 ELSE 0 END) AS deepscroll,
COUNT(DISTINCT CASE WHEN eventname = 'click' THEN elementtext END) AS internalclicks
FROM ga4events
WHERE date >= '2024-01-01'
GROUP BY 1, 2, 3
),
engagementattribution AS (
SELECT
ce.page,
DATE(ce.sessiondate) AS date,
COUNT(DISTINCT ce.userpseudoid) AS users,
AVG(ce.engagementseconds) AS avgengagement,
SUM(ce.deepscroll) / COUNT() AS scrollrate,
SUM(CASE WHEN conv.revenue > 0 THEN 1 ELSE 0 END) AS conversions,
SUM(conv.revenue) AS revenue,
-- Weight attribution by engagement
SUM(conv.revenue (ce.engagementseconds / 60)) AS engagementweightedrevenue
FROM contentengagement ce
LEFT JOIN conversions conv ON ce.userpseudoid = conv.userpseudoid
AND conv.conversiontime > ce.sessionstart
AND conv.conversiontime < TIMESTAMPADD(ce.sessionstart, INTERVAL 30 DAY)
GROUP BY 1, 2
)
SELECT
page,
AVG(avgengagement) AS typicalengagementseconds,
AVG(scrollrate) * 100 AS deepscrollrate,
SUM(conversions) AS totalconversions,
SUM(revenue) AS directrevenue,
SUM(engagementweightedrevenue) AS engagementweightedrevenue,
ROUND(SUM(engagementweightedrevenue) / SUM(revenue), 2) AS engagementmultiplier
FROM engagementattribution
WHERE date >= DATESUB(CURRENTDATE(), INTERVAL 30 DAY)
GROUP BY 1
HAVING SUM(users) > 100 -- Minimum sample size
ORDER BY engagementweighted_revenue DESC
``
This model does three things most SEO experiment tracking misses. First, it establishes a proper baseline using pre-experiment data. Second, it includes a control group to account for external factors like algorithm updates or seasonal shifts. Third, it tracks revenue impact—not just ranking changes.
Production-ready monitoring that replaces one-off dashboards
The average marketing team has more dashboards than anyone actually looks at. They get built to answer a specific question, answer it once, then sit unused. Instead of adding another one, build a monitoring system that surfaces what matters automatically.
Here's a complete monitoring query that replaces most SEO dashboards:
``sql
CREATE OR REPLACE TABLE project.dataset.seomonitoringdaily AS
WITH performancesummary AS (
SELECT
CURRENTDATE() AS reportdate,
-- Traffic metrics
(SELECT COUNT(DISTINCT userpseudoid) FROM ga4organic WHERE date = DATESUB(CURRENTDATE(), INTERVAL 1 DAY)) AS yesterdayusers,
(SELECT COUNT(DISTINCT userpseudoid) FROM ga4organic WHERE date = DATESUB(CURRENTDATE(), INTERVAL 8 DAY)) AS lastweekusers,
-- Revenue metrics
(SELECT SUM(revenue) FROM organicconversions WHERE date = DATESUB(CURRENTDATE(), INTERVAL 1 DAY)) AS yesterdayrevenue,
(SELECT AVG(dailyrevenue) FROM (
SELECT SUM(revenue) AS dailyrevenue
FROM organicconversions
WHERE date BETWEEN DATESUB(CURRENTDATE(), INTERVAL 30 DAY) AND DATESUB(CURRENTDATE(), INTERVAL 1 DAY)
GROUP BY date
)) AS avgdailyrevenue30d,
-- Ranking metrics
(SELECT AVG(position) FROM gscdata WHERE date = DATESUB(CURRENTDATE(), INTERVAL 3 DAY)) AS currentavgposition,
(SELECT COUNT(DISTINCT query) FROM gscdata WHERE date = DATESUB(CURRENTDATE(), INTERVAL 3 DAY) AND position <= 10) AS keywordstop10,
-- Content performance
(SELECT COUNT(DISTINCT page) FROM gscdata WHERE date = DATESUB(CURRENTDATE(), INTERVAL 3 DAY) AND clicks > 0) AS pageswithclicks,
(SELECT COUNT(DISTINCT page) FROM contentpublished WHERE publishdate = DATESUB(CURRENTDATE(), INTERVAL 7 DAY)) AS newcontentlastweek
),
topchanges AS (
SELECT
'Biggest Position Gains' AS metrictype,
query AS item,
ROUND(yesterdayposition - weekagoposition, 1) AS change,
CONCAT('Moved from ', ROUND(weekagoposition, 1), ' to ', ROUND(yesterdayposition, 1)) AS details
FROM (
SELECT
query,
AVG(CASE WHEN date = DATESUB(CURRENTDATE(), INTERVAL 3 DAY) THEN position END) AS yesterdayposition,
AVG(CASE WHEN date = DATESUB(CURRENTDATE(), INTERVAL 10 DAY) THEN position END) AS weekagoposition,
SUM(CASE WHEN date = DATESUB(CURRENTDATE(), INTERVAL 3 DAY) THEN impressions END) AS recentimpressions
FROM gscdata
GROUP BY query
HAVING recentimpressions > 100
)
WHERE yesterdayposition < weekagoposition
ORDER BY change
LIMIT 5
UNION ALL
SELECT
'Top Revenue Pages' AS metrictype,
page AS item,
ROUND(revenue, 2) AS change,
CONCAT(conversions, ' conversions') AS details
FROM (
SELECT page, SUM(revenue) AS revenue, COUNT(DISTINCT transactionid) AS conversions
FROM pagerevenueattribution
WHERE date >= DATESUB(CURRENTDATE(), INTERVAL 7 DAY)
GROUP BY page
ORDER BY revenue DESC
LIMIT 5
)
),
alerts AS (
SELECT
CASE
WHEN yesterdayusers < lastweekusers 0.7 THEN CONCAT('⚠️ Traffic down ', ROUND((1 - yesterdayusers/lastweekusers) 100), '% vs last week')
WHEN yesterdayrevenue < avgdailyrevenue30d 0.5 THEN CONCAT('🚨 Revenue significantly below 30-day average')
WHEN currentavgposition > 15 THEN CONCAT('📉 Average position dropped to ', ROUND(currentavgposition, 1))
WHEN keywordstop10 < 100 THEN CONCAT('⚠️ Only ', keywordstop10, ' keywords in top 10')
ELSE '✅ All metrics within normal range'
END AS alertmessage,
yesterdayusers,
yesterdayrevenue,
currentavgposition,
keywordstop10
FROM performancesummary
)
SELECT FROM alerts
UNION ALL
SELECT item AS alertmessage, change, NULL, NULL, NULL FROM top_changes
``
Schedule this to run every morning and pipe results to Slack. You've just replaced five dashboards with one query that actually tells you what needs attention.
When to build versus buy your attribution pipeline
Building attribution infrastructure is a 3–6 month project minimum. You need data engineering resources, pipeline maintenance, and ongoing query optimization. Most marketing teams underestimate this by a significant margin.
The build path makes sense when you have:
-
Full-time data engineering support
-
Complex attribution requirements beyond standard models
-
Budget for ongoing maintenance (figure 20–30 hours monthly)
-
Time to wait for results—nothing useful happens in month one
For a typical SaaS company doing $5–10M ARR, building attribution infrastructure costs somewhere in the range of $50–75K in engineering time, plus ongoing maintenance. The queries above are a starting point, not a complete solution.
This is where operational software with built-in attribution becomes valuable. Instead of building pipelines from scratch, platforms designed for marketing operations already handle data ingestion, join logic, and monitoring. They've solved the URL matching problems, built the identity resolution, and maintain the API connections.
The real advantage isn't avoiding the initial build—it's avoiding the maintenance burden. Google changes their API, your pipeline breaks. GA4 updates their schema, your joins fail. Your data engineer leaves, nobody understands the attribution logic. With purpose-built software, those become vendor problems instead of yours.
Common attribution pipeline failures and fixes
After watching dozens of attribution projects fail, the patterns get predictable. Here are the failures that kill most pipelines and how to prevent them.
Failure 1: Identity Resolution Breaks
``sql
-- Probabilistic user matching
WITH usersignals AS (
SELECT
userpseudoid,
ARRAYAGG(DISTINCT email IGNORE NULLS) AS emails,
ARRAYAGG(DISTINCT phone IGNORE NULLS) AS phones,
ARRAYAGG(DISTINCT deviceid IGNORE NULLS) AS devices,
MIN(firstseen) AS earliesttouch
FROM usertouchpoints
GROUP BY 1
),
matchedusers AS (
SELECT
u1.userpseudoid AS primaryuser,
u2.userpseudoid AS matcheduser,
CASE
WHEN ARRAYLENGTH(ARRAYINTERSECT(u1.emails, u2.emails)) > 0 THEN 'emailmatch'
WHEN ARRAYLENGTH(ARRAYINTERSECT(u1.phones, u2.phones)) > 0 THEN 'phonematch'
WHEN ARRAYLENGTH(ARRAYINTERSECT(u1.devices, u2.devices)) > 0 THEN 'devicematch'
END AS matchtype
FROM usersignals u1
CROSS JOIN usersignals u2
WHERE u1.userpseudoid != u2.userpseudoid
AND (ARRAYLENGTH(ARRAYINTERSECT(u1.emails, u2.emails)) > 0
OR ARRAYLENGTH(ARRAYINTERSECT(u1.phones, u2.phones)) > 0
OR ARRAYLENGTH(ARRAYINTERSECT(u1.devices, u2.devices)) > 0)
)
SELECT primaryuser, ARRAYAGG(matcheduser) AS unifiedusers
FROM matchedusers
GROUP BY 1
``
Identity resolution alone can swing attributed revenue numbers by 20–30% depending on how much cross-device traffic you're seeing, so this isn't optional if you want numbers you can trust.
Failure 2: Time Zone Misalignment
``sql
-- Standardize all timestamps to UTC
SELECT
DATETIME(PARSETIMESTAMP('%Y%m%d', eventdate), 'UTC') AS utctimestamp,
DATETIME(PARSETIMESTAMP('%Y%m%d', eventdate), 'America/LosAngeles') AS pttimestamp,
-- Convert GSC dates (always in PT) to UTC
DATETIME(DATETIME(gscdate, 'America/LosAngeles'), 'UTC') AS gscutc_timestamp
``
Failure 3: Bot Traffic Contamination
``sql
-- Bot detection and filtering
WITH botsignatures AS (
SELECT userpseudoid
FROM usersessions
WHERE
-- Suspicious patterns
sessionsperday > 100
OR pagespersession > 500
OR avgtimeonpage < 0.5
OR useragent LIKE '%bot%'
OR useragent LIKE '%crawl%'
OR useragent LIKE '%spider%'
)
SELECT * FROM attributiondata
WHERE userpseudoid NOT IN (SELECT userpseudoid FROM botsignatures)
``
Once you've patched these three failure modes, your pipeline will be materially more reliable across all three of the core SQL models covered earlier.
Moving from dashboard chaos to attribution clarity
Most marketing teams are drowning in data but starving for insights. They have GSC showing keyword rankings, GA4 tracking sessions, a CRM recording deals—but no clear line from "this keyword" to "that revenue." The dashboards multiply but the questions stay unanswered.
Building an SEO data pipeline isn't about perfection. Start with the first SQL model—just connecting GSC clicks to GA4 sessions. Run it for a week. You'll immediately spot issues: URLs that don't match, traffic that disappears, conversions that can't be traced. Fix one problem at a time.
The queries in this post handle the edge cases that break most attribution attempts: URL parameter chaos, cross-device journeys, bot contamination, timezone misalignment. But they're still just queries. The real work is maintaining them as your business evolves, especially when GA4 decides to change something quietly.
Within 30 days of implementing proper attribution, most teams discover their SEO investment is either dramatically undervalued or focused on the wrong keywords—sometimes both. One B2B SaaS team found their "money keywords" with 500 monthly searches drove zero revenue, while a single long-tail article was generating around $400K annually.
Start with one query. Pick the GSC to GA4 join. Run it tomorrow morning. You'll learn more about your actual SEO performance from that one result than from a dozen dashboard reviews.
Ready to elevate your search rankings?
Join 5,000+ businesses using GoSeofy to increase organic traffic, optimize content, and outperform competitors online.