

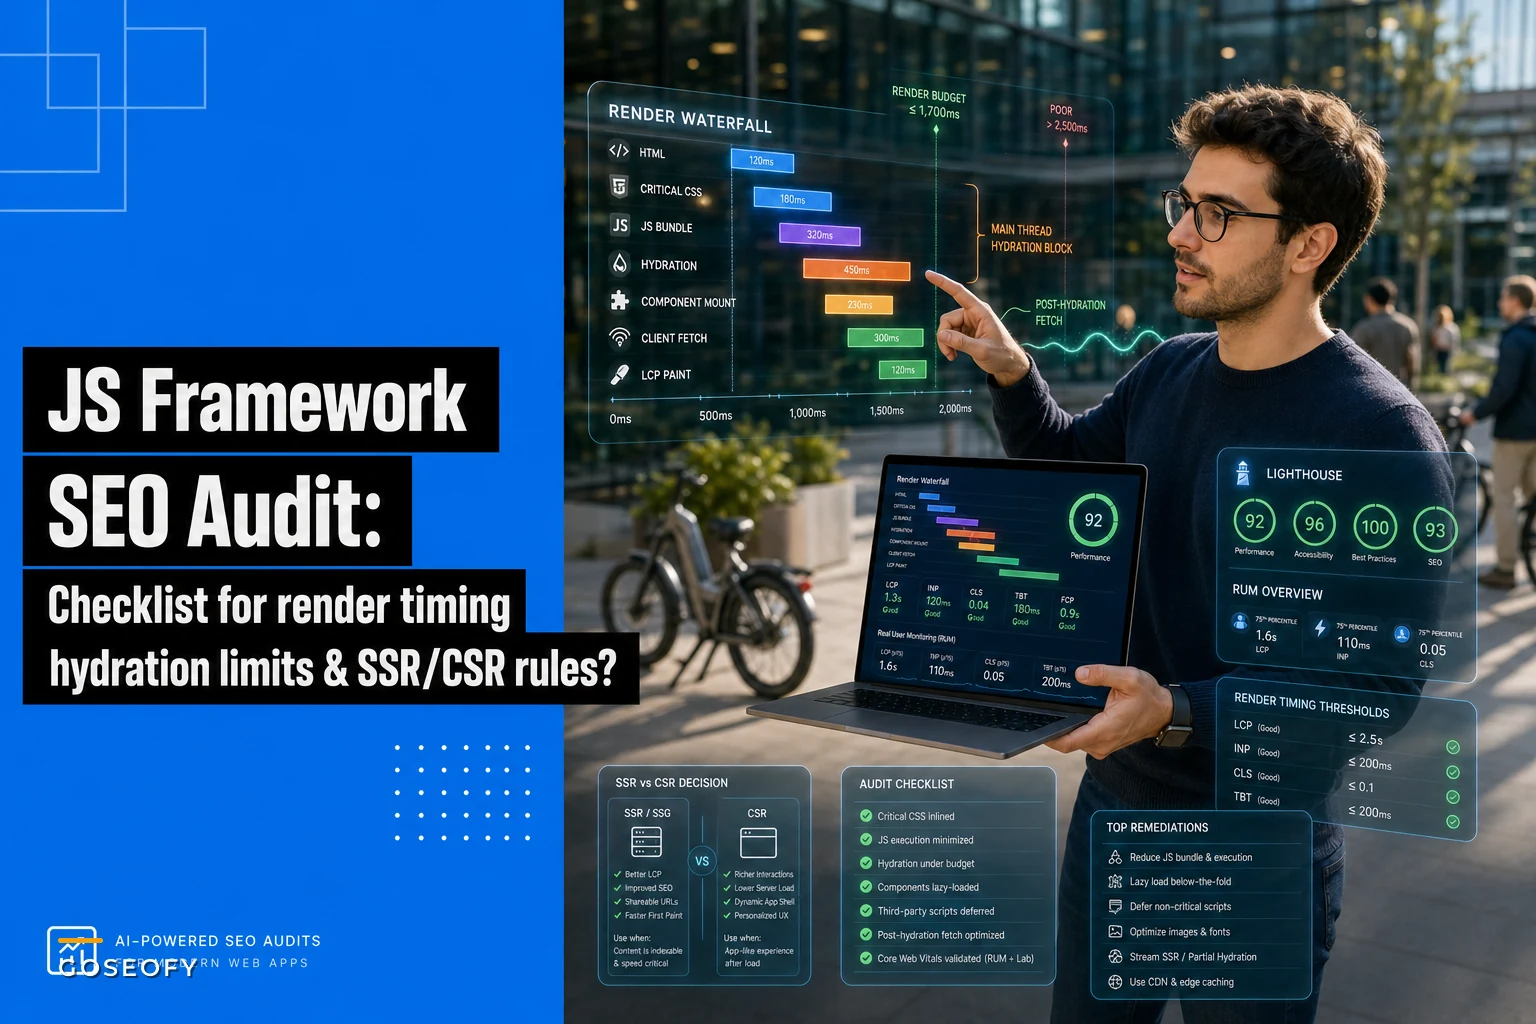

Most JS framework SEO problems don't show up as a hard failure. The page renders fine in Chrome, the content is "there," and everyone moves on. Then three weeks later organic impressions on a key template are down 20% and nobody can point to a deploy that caused it.
What actually happened is subtler: the markup Google needs for ranking signals arrives too late in the render waterfall, or hydration blocks interactivity long enough that field metrics quietly degrade. These aren't catastrophic bugs — they're timing problems. And timing problems are exactly what a visual QA pass never catches.
This is a working audit you can run against a real React/Next, Vue/Nuxt, or SvelteKit site. Thresholds, lab-plus-field check pairings, SSR vs CSR decision rules, and remediation templates engineers can lift directly. No theory about how hydration works — you already know that part.
Why render timing breaks ranking even when the page "looks fine"
Modern frameworks create a trap because there are two very different questions that feel identical:
Googlebot will render JS — that's been true for a long time. But rendering happens in a deferred queue, and the budget it gives any single URL isn't infinite. When your title, canonical, structured data, or main content depends on a client-side fetch that fires after hydration, you're betting on that whole chain completing inside the render budget. Sometimes it does. On a slow template with a heavy bundle, sometimes it doesn't — and you get intermittent indexing where 80% of a template indexes clean and the rest flap in and out.
The second problem is field metrics. A heavy hydration pass delays interaction readiness, which hits INP and sometimes delays LCP when the largest element is swapped in post-hydration. Lab tools won't always catch this because they run on controlled hardware. Your actual users on mid-range Android phones are the ones eating the delay. That's the whole reason this audit pairs Lighthouse (lab) with RUM (field) — either one alone will mislead you.
Worth naming a pattern: the sites that get burned worst are the ones that migrated to a framework for "performance" and measured success on a desktop Lighthouse score. Desktop Lighthouse on a fast CI runner is probably the single most misleading number in this space.
The audit: what to measure and the thresholds that matter
Run every check below per template, not per site. A homepage and a product detail page have completely different render profiles, and averaging them hides the template that's actually bleeding.
Stop losing visibility in search results.
GoSeofy helps you monitor, analyze, and improve your SEO performance with ease.
- Comprehensive keyword tracking
- Backlink quality monitoring
- Real-time SEO performance reports
No credit card required
| Check | Source | Green | Warn | Fail |
|---|---|---|---|---|
| LCP (field, p75 mobile) | RUM | ≤ 2.5s | 2.5–4.0s | > 4.0s |
| INP (field, p75 mobile) | RUM | ≤ 200ms | 200–500ms | > 500ms |
| Time to first meaningful markup in SSR response | Lab/curl | content present | partial | content absent |
| Hydration duration (main thread block) | Lab trace | ≤ 200ms | 200–600ms | > 600ms |
| Render waterfall depth to LCP resource | Lab trace | ≤ 3 hops | 4–5 hops | ≥ 6 hops |
| Critical content requires post-hydration fetch | Lab/DOM diff | no | — | yes |
| Title/canonical/structured data in raw HTML | curl | yes | — | no |
The two that quietly cause the most SEO damage are the last two "Fail" conditions. If critical content or canonical markup only exists after a client fetch, you're not debugging a performance issue — you're debugging an indexing issue wearing a performance costume.
The raw-HTML check nobody runs often enough
``
curl -A "Googlebot" https://yoursite.com/some-template-url | grep -i "<title\|canonical\|application/ld+json"
``
If your title, canonical, or JSON-LD isn't in that raw response, it's being injected client-side. For a lot of frameworks with partial or misconfigured SSR, that's exactly what's happening and nobody noticed because the rendered DOM in devtools looks perfect. The raw HTML and the rendered DOM are two different documents. Google's first pass sees the raw one.
Running the render-waterfall analysis
The render waterfall is where "it's fast enough" claims tend to fall apart. You're looking for the chain of dependencies between the HTML arriving and the LCP element painting.
A healthy chain on an SSR page looks like: HTML → critical CSS → LCP image/text. Three hops, done.
A broken chain looks like: HTML → JS bundle → hydration → component mount → client fetch → state update → LCP paint. Six hops, and every hop is a place latency compounds.
Here's the process to run per template:
-
Pull a Lighthouse trace on mobile throttling — not desktop, this part isn't optional.
-
Open the performance trace and find the LCP marker.
-
Walk backwards from LCP and count every network request and main-thread task it depended on.
-
If an XHR/fetch sits between hydration and LCP, flag it as a post-hydration content dependency.
-
Measure the longest main-thread task during hydration — that's your hydration block number.
-
Cross-check INP in RUM for that template. If lab hydration block is high and field INP is in warn/fail, you've confirmed the problem is real, not a lab artifact.
That step 6 pairing is what most audits skip. Lab tells you why; field tells you whether it matters to actual users and crawlers. A high hydration block on a template with solid field INP — maybe it's a low-interaction page — is lower priority than a moderate block on a high-traffic, high-interaction template.
This is also where clean data lineage pays off. If your RUM and crawl data live in disconnected systems, you'll spend half the audit arguing about whether a number is trustworthy. Having solid joins between field data and the rest of your SEO stack — the kind of thing covered in SEO data observability: lineage, ownership and alerts to trust GSC/GA joins — is what lets you actually act on an audit rather than relitigating the inputs.
Visualizing the dependency chain can make it much easier to spot post-hydration fetches and long main-thread tasks.
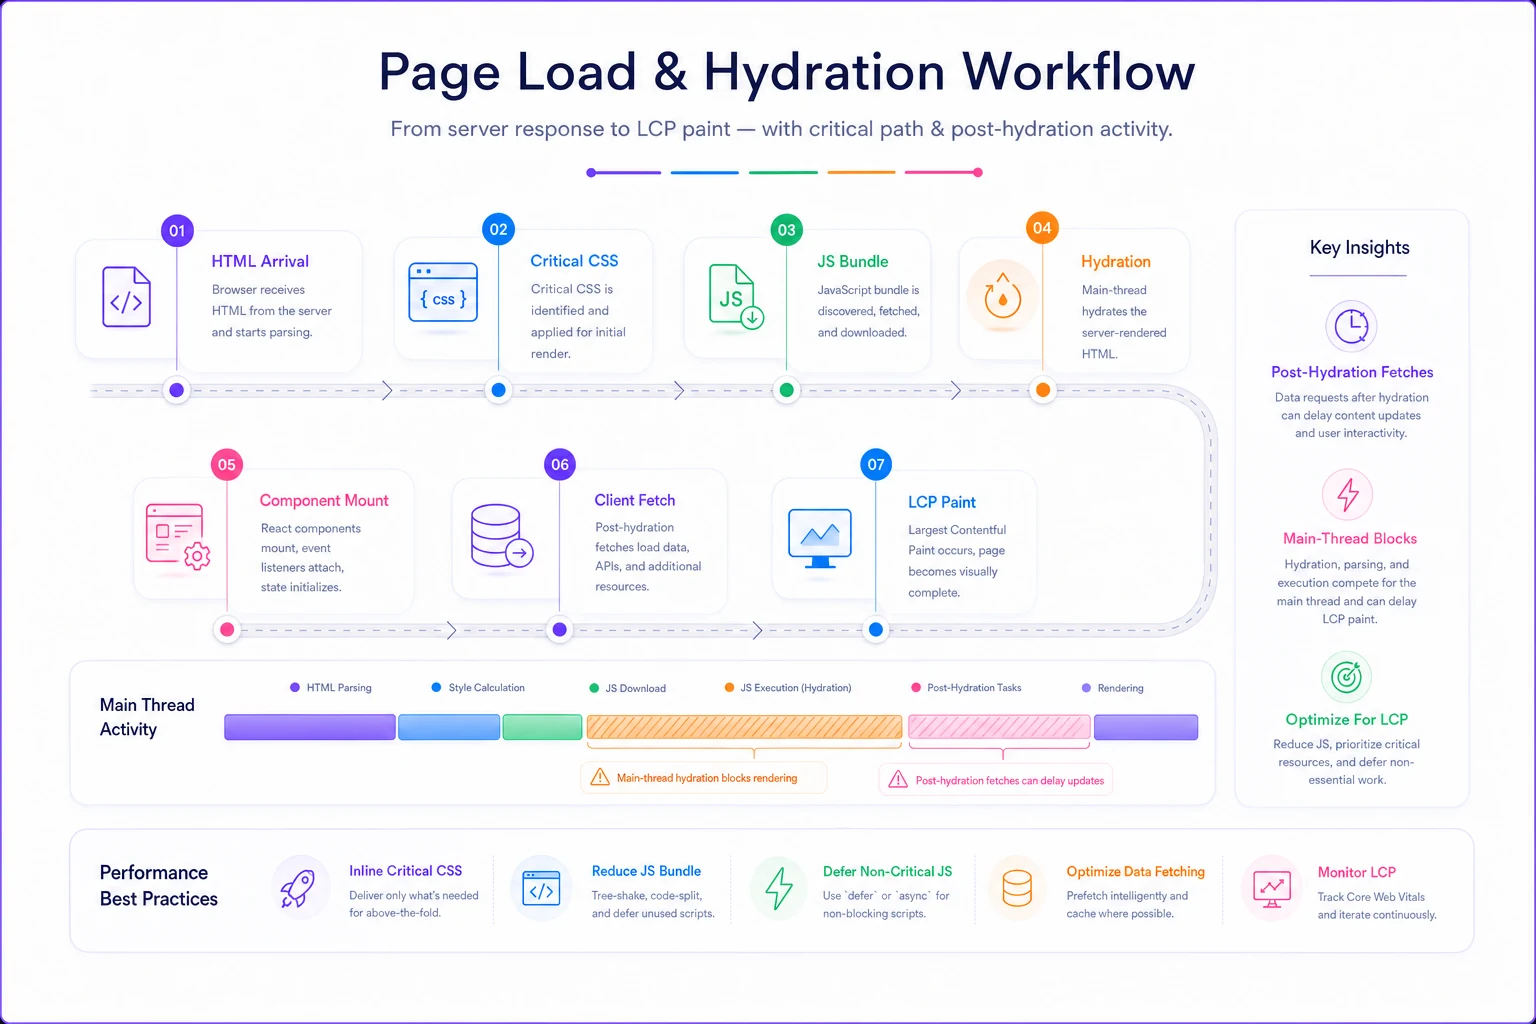
Save mobile-throttled Lighthouse trace files so you can diff render-waterfall changes across deploys.
Keep the visualization with your audit notes and link it to the RUM numbers so engineers can reproduce the exact dependency chain you're flagging.
SSR vs CSR decision rules per template
Teams tend to treat this as an all-or-nothing architecture decision. In practice the right call is per-template, and it comes down to two questions: does the content need to rank, and does it change per request.
-
Content must rank + mostly static → SSR or SSG. Non-negotiable. Product pages, category pages, articles, landing pages. Ranking-relevant markup has to be in the raw HTML.
-
Content must rank + personalized/dynamic → SSR with streaming, or static shell with server-rendered critical content. Do not push ranking content to a client fetch.
-
Content doesn't need to rank + highly interactive → CSR is fine. Account dashboards, internal tools, logged-in app views.
-
Mixed page (rankable content + interactive widgets) → SSR the content, hydrate the widgets selectively. The mistake here is hydrating the whole page just to make one widget interactive.
The most common misdiagnosis: a team sees a slow SSR page and decides "SSR is slow, let's go client-side." The actual problem is almost always an unoptimized server render or an oversized bundle blocking hydration. Switching to CSR doesn't fix the slowness — it moves it onto the crawler's render budget, which is worse for SEO, not better.
When CSR is genuinely the wrong call
If a template appears in Search Console with impressions, if it's a primary organic entry point, or if its content changes per URL — prices, availability, listings — CSR for the primary content is a bad idea. You can CSR the chrome around it. You cannot CSR the thing you're trying to rank.
When over-engineering SSR is the wrong call
Don't SSR a logged-in dashboard that no crawler should ever see. You'll pay server cost and complexity for zero SEO benefit. The rule is boring but it works: SSR what ranks, CSR what doesn't, and stop treating it as an identity.
Remediation templates engineers can apply
These map directly to the fail conditions in the threshold table. Hand them to engineering as-is.
Fail: critical content requires post-hydration fetch
Move the fetch server-side. In Next, that's a server component or getServerSideProps/generateStaticParams depending on update cadence. In Nuxt, useAsyncData with server rendering enabled. The content ships in the HTML; the client hydrates existing markup instead of fetching and inserting it.
Fail: title/canonical/structured data absent from raw HTML Render metadata server-side. If you're using a client-side head manager that only runs after mount, swap it for the framework's server-rendered head API. Verify with the same curl check — this is usually a 20-minute fix that recovers intermittent indexing more reliably than almost anything else on this list.
Fail/Warn: hydration duration too high Three levers, in order of effort: (1) code-split so the template only ships the JS it actually needs, (2) adopt partial/selective hydration so non-interactive content never hydrates, (3) defer non-critical hydration until after LCP. The biggest wins usually come from the first — teams ship the entire component library to a page that uses four components.
Warn/Fail: render waterfall depth
Preload the LCP resource, inline critical CSS, and remove any client fetch from the LCP critical path. If the LCP element is an image swapped in post-hydration, render it server-side with the correct src so it's discoverable in the initial HTML.
Field INP in warn/fail despite decent lab scores Almost always hydration cost on real hardware. Reduce main-thread work during hydration and break up long tasks. Re-measure in field after a couple of weeks — lab won't confirm the fix, only RUM will.
A real scenario
A mid-sized outdoor gear retailer with around 4,000 product URLs migrated to a React framework and lost roughly 15% of organic product-page impressions over about six weeks. Desktop Lighthouse scores were in the 90s, so the dev team assumed nothing was wrong.
The curl check told a different story in about five minutes: product titles and JSON-LD were being injected client-side by a head manager that only ran after mount. The raw HTML had a generic template title and no product structured data. A significant portion of product pages were indexing with the wrong title or flapping in and out of the index entirely — on the slower product templates, Googlebot's render pass wasn't reliably completing the client-side head injection.
The fix was moving head rendering and the product data fetch server-side. Nothing exotic. Within the next crawl cycles the correct titles and structured data appeared in the raw response, intermittent indexing settled, and impressions recovered to roughly pre-migration levels over about two months. The lingering INP issue on mobile — a separate hydration-weight problem — took a code-split pass to bring the p75 back under control.
The lesson wasn't "React is bad for SEO." It was that the team's success metric had been a desktop lab score, and the actual problems lived in the raw HTML response and mobile field data — two places that score never touched.
The audit checklist
Run this per template, top to bottom:
-
- [ ] Curl the URL as Googlebot — confirm title, canonical, and JSON-LD exist in raw HTML
-
- [ ] Confirm primary ranking content is present in raw HTML, not injected post-hydration
-
- [ ] Pull a mobile-throttled Lighthouse trace (ignore desktop entirely for this)
-
- [ ] Count render-waterfall hops from HTML to LCP paint — flag ≥ 6
-
- [ ] Identify any fetch sitting between hydration and LCP — flag it
-
- [ ] Measure longest hydration main-thread task — flag > 600ms
-
- [ ] Pull field p75 LCP and INP for the template from RUM
-
- [ ] Cross-check
high lab hydration block + warn/fail field INP = real priority
-
- [ ] Apply the SSR vs CSR decision rule — does this template's architecture match its ranking need?
-
- [ ] Assign the matching remediation template to engineering with the failing number attached
The cross-check line is what separates a useful audit from a pile of lab numbers. Lab without field over-prioritizes problems real users never feel. Field without lab tells you something's wrong but never why.
Where this fits in a migration
If you're running this audit because of a replatform or framework migration, do it before the switch is fully live — not after impressions drop. Render-timing and hydration failures are among the quietest post-migration regressions. No broken links, no 404s, just content arriving a beat too late for the crawler.
Folding these checks into the broader migration monitoring approach in the technical SEO migration playbook, with explicit rollback criteria tied to these thresholds, is what keeps a framework move from turning into a slow organic bleed you only notice weeks later.
Closing thought
JS framework SEO audits get skipped because the pages look fine. They render, they're interactive, the Lighthouse score is green on someone's fast laptop. But the crawler sees the raw HTML first, real users run mid-range phones, and both of those truths live outside the view the dev team is usually looking at.
Run the curl check, run the mobile trace, pair it with field data, and apply the SSR vs CSR rule per template. That's the whole job — and it catches the problems well before they turn into a chart nobody can explain.
Ready to elevate your search rankings?
Join 5,000+ businesses using GoSeofy to increase organic traffic, optimize content, and outperform competitors online.