



The scariest kind of SEO data problem isn't the one that throws an error. It's the one where everything looks normal. The dashboard loads, the numbers are in a plausible range, the weekly report goes out, and nobody notices that the GSC-to-GA join silently dropped 18% of your product URLs three weeks ago because someone changed the URL structure on a subset of category pages.
That's the problem data observability actually solves. Not "is the pipeline running" — most teams have that covered. It's "can I trust what came out the other end." And in SEO specifically, pipelines are unusually fragile because you're stitching together sources that were never designed to be joined: Search Console's aggregated, sampled, privacy-throttled export; GA4's event-based session model; and raw server logs that speak a completely different language about the same URLs.
Most SEO teams treat these three sources as if they agree with each other. They don't. The gap between what they report and what actually happened is exactly where bad decisions get made — pruning a page that was actually converting, declaring a title test a winner when the measurement was broken, or missing a soft indexing collapse because the join hid it.
This is a systems article, not a tips list. The goal is to walk through how an SEO data pipeline breaks quietly at each stage, and how to borrow the discipline data engineering teams already use — lineage, ownership, freshness checks, schema alerts — and apply it specifically to the GSC/GA/log stack.
Why SEO pipelines break differently than normal data pipelines
If you've ever worked next to a data engineering team, you've heard them talk about observability pillars: freshness, volume, schema, distribution, lineage. Those concepts map onto SEO surprisingly well, but the failure modes are different enough that copying a generic playbook doesn't work.
The core issue is this. In a normal analytics pipeline, your inputs are internal — your own database, your own event tracking. You control the schema. When something changes, someone on your team pushed that change. In SEO pipelines, two of your three primary sources are external and change without warning:
-
Google Search Console changes sampling behavior, adds property types, silently adjusts how it attributes queries, and caps rows in the API export. Your row count can drop 30% with zero code changes on your end.
-
GA4 shifts session definitions, applies thresholding that suppresses low-volume rows, and reprocesses data retroactively so yesterday's number isn't the same today.
-
Server logs are the only source you fully control, and they're the one most teams ignore because parsing them is tedious.
So the observability question in SEO isn't just "did my code break." It's "did one of my vendors quietly change the ground beneath me." That reframes everything. You're not just monitoring your pipeline — you're monitoring the boundary between your pipeline and three systems you don't own.
Worth noting: the teams that get burned worst tend to have the most polished-looking dashboards. Clean reporting creates false confidence. Nobody questions a clean chart. The messy spreadsheet gets double-checked; the beautiful Looker dashboard gets trusted blindly.
The join is where the truth quietly dies
Almost every serious SEO measurement problem I've traced back has died at a join. Specifically, the URL join.
Stop losing visibility in search results.
GoSeofy helps you monitor, analyze, and improve your SEO performance with ease.
- Comprehensive keyword tracking
- Backlink quality monitoring
- Real-time SEO performance reports
No credit card required
You'd think matching GSC data to GA4 data by URL would be straightforward. It isn't. Consider what happens to a single product page as it moves through your stack:
-
GSC reports it with
https// and no trailing slash.
-
GA4 stores the path only, sometimes with query parameters, sometimes stripped depending on your filtering config.
-
Your logs show it with a session ID appended and mixed casing.
-
A CDN rewrite adds a locale prefix on some requests but not others.
Now you JOIN ON url. What percentage matches cleanly? In real pipelines this lands anywhere from 70% to 95%, and teams running them usually assume it's 100% because they never measured the drop.
The operational trap: the URLs that fail to join are not random. They cluster. Parameterized URLs fail more. Newer templates fail more. International variants fail more. So the 12% you silently lose isn't a representative sample — it's often your most dynamic, highest-change-risk pages. You end up blind precisely where you most need visibility.
A quick validation you can run before building anything else: count distinct URLs in each source, count the successful joins, and look at the characteristics of what fell out. If the unmatched set skews toward one template or one directory, your join logic is your biggest measurement liability, not your reporting layer.
Ownership maps: the boring fix nobody wants to do
Every broken SEO pipeline I've unpicked had the same root cause underneath the technical symptom: nobody owned the specific thing that broke.
The URL normalization logic? "The analyst who set it up left." The GSC API credentials? "Marketing thinks IT owns it, IT thinks marketing owns it." The GA4 filter config? "We're not sure who last changed it." This ambiguity is fatal because when a number looks wrong, the first 90 minutes get burned figuring out whose problem it is before anyone starts fixing it.
An ownership map for an SEO pipeline doesn't need to be complicated. It just needs to name a human for every stage. Here's a workable structure:
| Pipeline stage | What can break | Named owner | Detection method |
|---|---|---|---|
| GSC extraction | API row caps, auth expiry, property changes | SEO analyst | Heartbeat query (below) |
| GA4 extraction | Schema changes, thresholding, reprocessing | Analytics eng | Volume + freshness check |
| Log ingestion | Format changes, bot filtering, sampling | DevOps / SRE | Row-count baseline |
| URL normalization | Join key mismatches | SEO analyst | Join match-rate monitor |
| Join / modeling | Silent row drops, fan-out duplication | Analytics eng | Distribution checks |
| Reporting layer | Stale cache, wrong date ranges | Whoever ships the report | Manual + freshness badge |
Name a single owner for each monitor (e.g., join match-rate) so alerts route immediately and avoid the "who owns this" delay.
The point of the map isn't bureaucracy. It's that when the join match rate drops from 91% to 74% on a Tuesday, there's exactly one person who gets the alert and exactly one person accountable for it. This is the same role clarity that separates teams that scale from teams that drown — covered in more depth in the SEO operations playbook on SLAs and ticket templates.
Heartbeat and synthetic GSC queries
Freshness monitoring is standard in data engineering — you check whether a table updated when it was supposed to. For GSC it needs a twist, because GSC data doesn't just arrive late, it arrives incomplete and then backfills.
A GSC heartbeat query is a small, deliberate check you run every day against a known-stable set of URLs and queries — pages you know rank consistently, terms you know drive impressions. You're not measuring performance. You're measuring whether the plumbing is delivering data that resembles reality.
The synthetic set works because it gives you a stable baseline. If your reference pages normally return impressions in a known band and one day return zero, you don't need to know why yet — you just know the pipe is broken or the data hasn't landed.
-
Silent auth expiry. The API stops returning data but doesn't loudly fail; your pipeline records zeros and your dashboard shows a "traffic drop."
-
Backfill windows. GSC's most recent 2–3 days are always incomplete. Teams panic over a "drop" that's just data not fully landed. A heartbeat that knows the expected backfill curve stops the false alarms.
-
Property or filter changes. Someone adds a domain property, the export logic grabs the wrong one, and your numbers quietly shift.
The thing most people miss: the majority of "sudden GSC traffic drops" reported internally are pipeline artifacts, not real ranking losses. A heartbeat query separates "the data is wrong" from "the world changed" — and that distinction saves entire days of misdirected firefighting.
Schema-change alerts: the thing that saves you at 2am
Schema drift is the quietest killer in the stack. GA4 adds a field, renames an event parameter, or changes how a dimension is populated, and your join logic doesn't error — it just starts producing subtly wrong output.
A schema-change alert is exactly what it sounds like: you snapshot the structure of each incoming source — column names, types, cardinality, the set of expected values — and diff it against the last known good state on every run. When something changes, you get told before the change flows downstream into a report someone's about to present.
-
New or missing columns in the GSC/GA4 export.
-
Type changes — a field that was an integer starts arriving as a string.
-
Cardinality shifts — a dimension that normally has ~50 values suddenly has 3, which usually means thresholding or a broken parse.
-
Enum drift — expected values like device categories or country codes change format.
There's a subtle mistake worth flagging: teams often build schema alerts that are so sensitive they fire constantly, everyone mutes the channel, and then the one alert that actually mattered gets ignored along with the noise. Tune for the changes that break joins. A new descriptive column you don't use doesn't need to wake anyone up. A type change on your join key does.
A validation workflow you can actually run
Here's the process worth standing up before trusting any GSC/GA/log join for real decisions. This is deliberately ordered — each step gates the next.
-
Baseline each source in isolation. Count rows, distinct URLs, and date coverage per source per day. Store these as a time series. You can't detect drift without a baseline.
-
Measure the join match rate. Run the join, then compute what percentage of each source's URLs matched. Set a floor (say 90%) and alert below it.
-
Profile the unmatched set. Group failures by template, directory, and URL pattern. This tells you whether your blind spots are dangerous or trivial.
-
Check for fan-out. A join that accidentally duplicates rows will inflate every metric downstream. Compare row counts before and after the join; unexpected growth means a many-to-many join is quietly multiplying your numbers.
-
Validate against a known-truth sample. Pick 10–20 URLs you can verify manually in the GSC and GA4 UIs. Confirm your pipeline's numbers match the source UIs within tolerance.
-
Reconcile experiment measurement separately. If the pipeline feeds A/B or title tests, verify the test and control groups join at the same rate. Differential join loss between groups will fake a result that isn't real.
This last point deserves emphasis because it's the most expensive failure. If your test group is a newer template and joins at 82% while control joins at 94%, your measured "lift" might be entirely an artifact of the measurement itself. The underlying trade-offs around sampling and reconciliation are worth reading alongside the guide on building an SEO data pipeline for revenue attribution.
Here's a visual of the validation workflow.
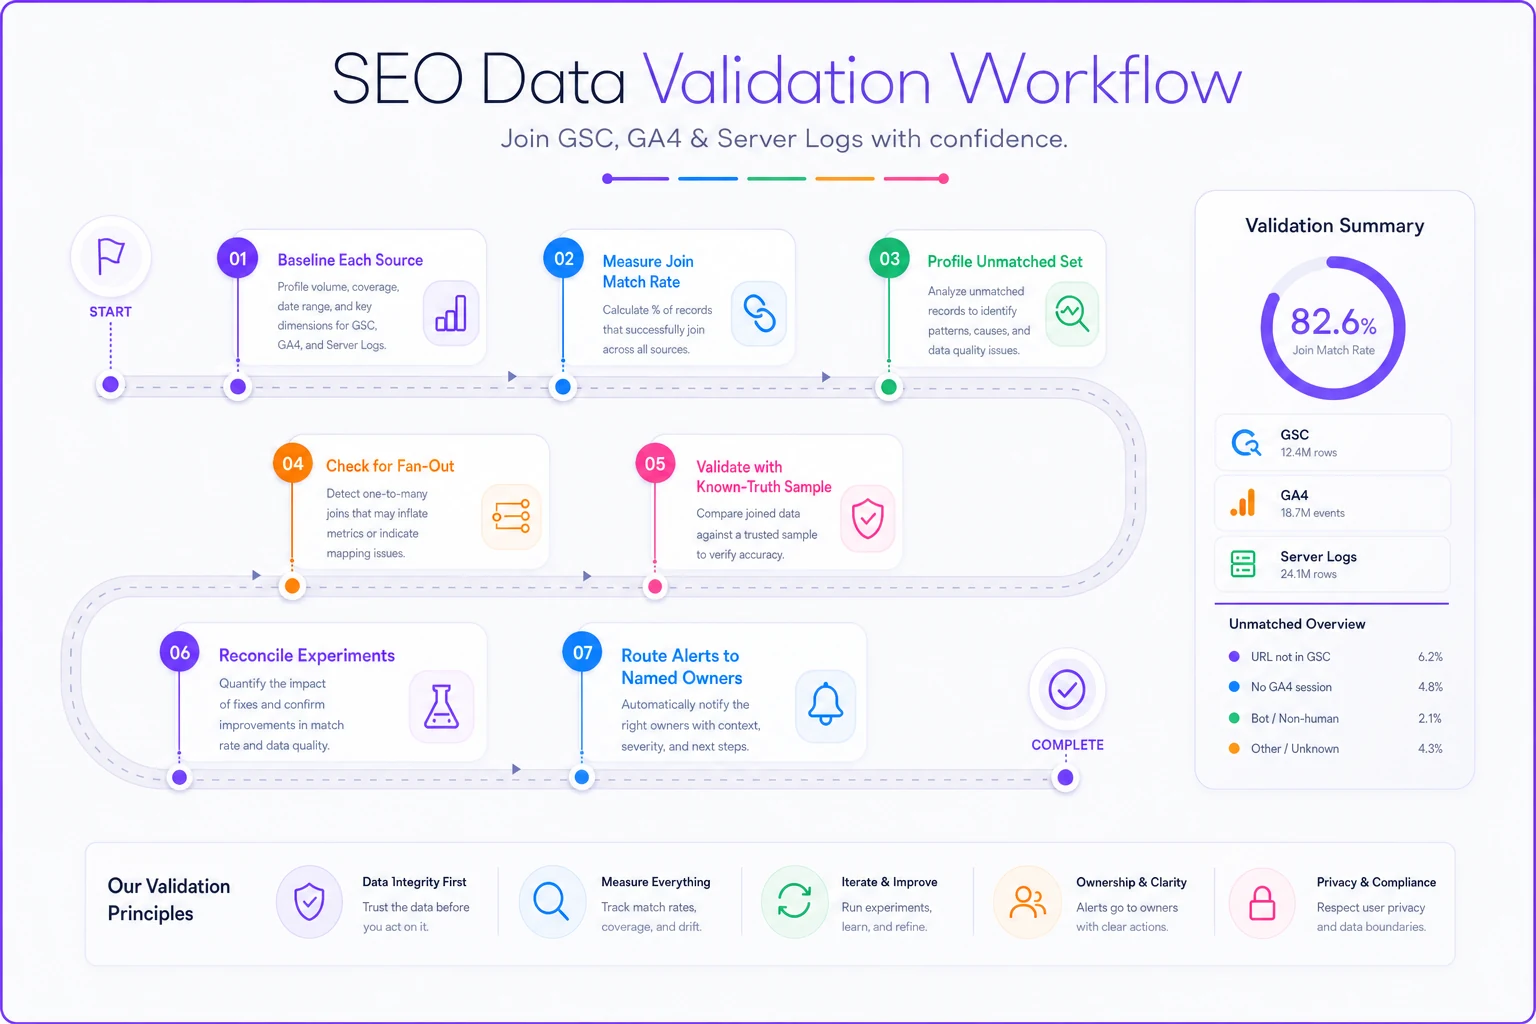
Use this sequence to automate detection and routing while keeping diagnosis and fixes human-led.
A real scenario: the "ranking drop" that wasn't
A mid-sized ecommerce operation — home goods, a few thousand indexed product and category pages — flagged an urgent problem. Their organic revenue dashboard showed roughly a 15% drop across two weeks. The SEO lead was already drafting a recovery plan and pulling the team off other work.
The actual cause: three weeks earlier, the dev team had rolled out locale prefixes on a portion of category URLs. GSC started reporting the new URLs. The GA4 side and the join logic were still normalizing to the old paths. So a chunk of URLs — the ones that had changed — simply stopped joining. The "revenue drop" was those URLs falling out of the joined table, not out of Google.
Once they profiled the unmatched set, the pattern was obvious in about twenty minutes: nearly all the failures shared the new locale prefix. Fixing the normalization logic recovered the "lost" revenue instantly, because it was never lost. The real cost wasn't ranking loss — it was roughly two weeks of team attention aimed at a problem that didn't exist, plus the credibility hit when leadership had already been told traffic was falling.
Without a join match-rate monitor, a URL structure change and a genuine ranking collapse look identical on the dashboard. Observability is what tells them apart.
When this level of rigor makes sense — and when it doesn't
Not every site needs a full observability layer.
This makes sense when:
-
You have thousands of URLs and manual spot-checking isn't feasible.
-
SEO decisions carry real budget — pruning, migrations, experiments driving spend.
-
Multiple people touch the pipeline, so ownership genuinely gets fuzzy.
-
You run experiments where a measurement error changes a business decision.
This is overkill when:
-
You're managing a few dozen pages and can eyeball GSC directly.
-
Your "pipeline" is one analyst pulling a monthly export.
-
Nobody makes irreversible decisions from the joined data yet.
Who should not build this: a small team that hasn't yet defined what a "good" SEO outcome even looks like. Observability protects a measurement framework — it doesn't replace one. If you haven't connected visibility metrics to actual revenue outcomes, build that foundation first. That grounding is the whole subject of connecting visibility, experiments, and revenue in a measurement framework, and it's the prerequisite, not the follow-up.
Where automation earns its place
Once the manual validation workflow exists and you trust it, running those checks by hand every day becomes the new bottleneck. This is the natural point where automation helps — not to replace judgment, but to run the heartbeat queries, diff the schemas, and watch the join match rate continuously so a human only gets pulled in when something actually crosses a threshold.
The useful mental model: automation handles the detection and the routing. It notices the match rate dropped, identifies which owner from your map is responsible, and surfaces the profiled unmatched set so that person starts with context instead of a blank screen. The diagnosis and the fix still belong to people. What you're removing is the part where a problem festers for two weeks because nobody was looking.
The trap to avoid is automating alerts before you've validated the checks manually. If you don't yet know what a normal join match rate looks like for your site, automation just generates confident, well-formatted noise.
Closing thought
The reason SEO teams get blindsided isn't that they lack data — they're drowning in it. The problem is that data passes through half a dozen transformations across three sources nobody fully controls, and at no point does anyone verify that what came out still means what everyone assumes it means.
Data observability for SEO is really just the discipline of not trusting your own dashboards until you've proven they deserve it. Ownership maps so problems have a home. Heartbeat queries so you know the pipes are flowing. Schema alerts so silent changes get loud. And join validation so the number you're about to make a decision on is real. Get those four working and the majority of your "mysterious traffic drops" stop being mysterious — because most of them were never traffic drops at all.
Ready to elevate your search rankings?
Join 5,000+ businesses using GoSeofy to increase organic traffic, optimize content, and outperform competitors online.